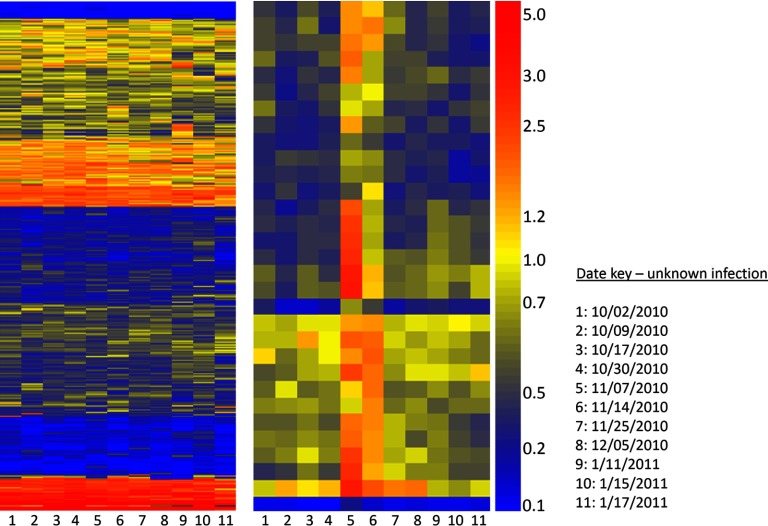
Fig. 8.
Time course of volunteer-submitted blood-samples over 3 months. Left: Heatmap represents Volunteer #11 who collected blood spots over a 3-month period between Oct. 2, 2010 and Jan. 17, 2011 (X-axis, time points are in order left to right, see Date Key) and self-reported health status. Y-axis shows all 10,000 peptides on the microarray, ordered by Euclidean distance. Right: Heatmap shows 31 peptides (Y-axis) selected by filtering for a consecutive change in signal existed across at least two subsequent time points. Peptides sequences are listed in Supplemental Information Table S6. Volunteer reported symptoms on or about Nov. 24, 2010.

