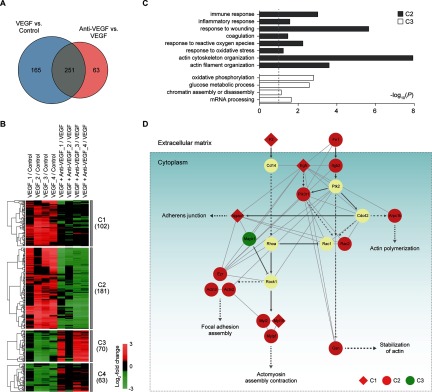
Fig. 2.
Retinal proteomes affected by VEGF and anti-VEGF antibody. A, relationships of the DEPs from the two comparisons (VEGF versus control and VEGF plus anti-VEGF versus VEGF). B, four major clusters (clusters 1–4) of the DEPs identified from the two comparisons. For each DEP in the two comparisons, the log2 fold-changes were calculated as the median ratios of the normalized reporter ion intensities of the differentially expressed peptides for the protein in individual samples (see also supplemental Fig. S2). The log2 fold-changes of the DEP were normalized by the median value of four replicates in control for VEGF versus control (VEGF/control, 1st to 4th columns) or in VEGF for anti-VEGF versus VEGF (anti-VEGF/VEGF, 5th to 8th columns). The underscored number followed by the condition indicates the replicate sample in the condition (e.g. VEGF_2 indicates the 2nd replicate sample under VEGF condition). The dendrogram shows how the DEPs in each cluster were clustered using a hierarchical clustering method (complete linkage and Euclidian distance). Color bar, gradient of log2 fold-changes between the two conditions indicated in each column. C, GOBPs represented by the DEPs in clusters 2 and 3 (gray and white, respectively). The bars represent −log10(P), where P is the significance of individual GOBPs being enriched by the DEPs, and the dotted line represents the cutoff of p value used (a default cutoff of DAVID). D, network model describing the DEPs associated with the regulation of actin cytoskeleton in the four major clusters (clusters 1–4). Node colors represent up-regulation (red) or down-regulation (green) of the corresponding proteins by VEGF treatment, and node shapes represent whether the alterations of the corresponding proteins by VEGF treatment were inhibited (circle, cluster 2) or not (diamond, cluster 1) by cotreatment of VEGF and anti-VEGF antibody. The arrow and inhibition symbol represent activation and suppression between the proteins obtained from the KEGG pathway database. Solid and dotted lines represent direct and indirect protein-protein interactions between the nodes, respectively, in cytoplasm (box) and extracellular matrix.

