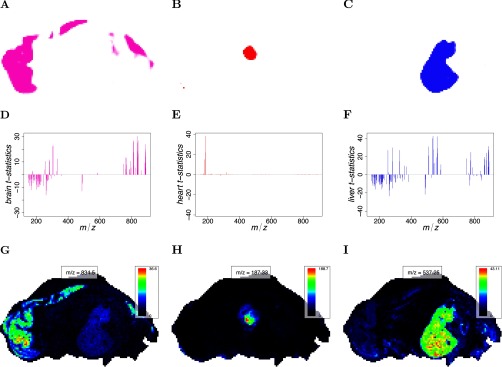
Fig. 5.
Pig fetus cross-section: t-statistics and representative single ion images. (A–C) The predicted segment membership probabilities from spatial shrunken centroids with SA distance. (A) the brain segment, (B) the heart segment, and (C) the liver segment. (D–F) The shrunken t-statistics of the spectral features. (D) The brain segment, (E) the heart segment, and (F) the liver segment. (G–I) The single ion images corresponding with the top-ranked spectral feature by shrunken t-statistic. (G) The brain segment, (H) the heart segment, and (I) the liver segment.

