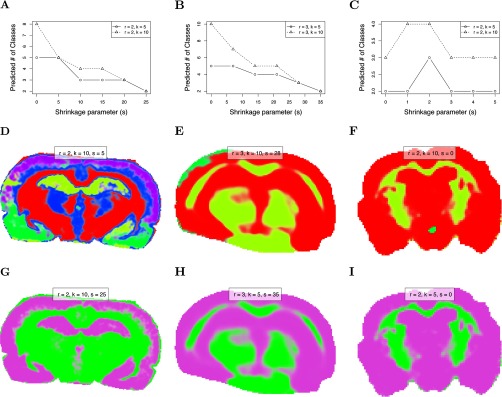
Fig. 6.
Comparison of segmentation uncertainty in datasets of differing quality. (A–C) show the predicted number of segments as the sparsity increases. (A) Rat brain (R1) with little noise. (B) Mouse brain (R2) with moderate noise. (C) Mouse brain (R3) with strong noise. (D–F) show the “best” segmentations selected by choosing the first (least sparse) segmentation after which the predicted number of segments are approximately equal for different initial numbers of segments. (D) Rat brain (R1). (E) Mouse brain (R2). (F) Mouse brain (R3). (G-I) show the segmentations resulting in two predicted segments through increasing sparsity. (G) Rat brain (R1). (H) Mouse brain (R2). (I) Mouse brain (R3).

