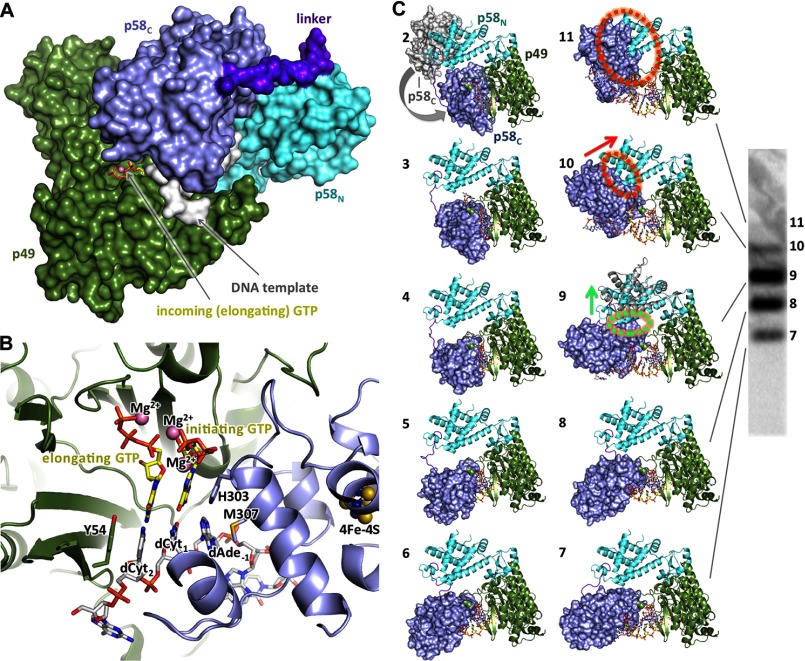
FIGURE 8.
Mechanism of RNA synthesis initiation, elongation, and termination. A, compact shape of primase in the initiation complex model. B, close-up view of the initiation mini duplex in the model. Position of the magnesium ion between the elongating and initiating GTPs was modeled to coordinate Asp-111, α-phosphate of elongating GTP, and O3′ of initiating GTP as in the active site of polymerases (58). C, models of the initiation and elongation complexes. The crystal structures of p58C-D/R, human primase (PDB code 4RR2), and p49-p58N–UTP complex (PDB code 4BPW) were used to build these models. Panel numbers correspond to the length of the growing RNA primer plus incoming NTP in the modeled complexes. Panel 2 corresponds to the initiation complex resulting in dinucleotide formation and also shows the position of p58C in apo-primase. The clash area is depicted by dotted circles (colored green or red to indicate avoidable or unavoidable steric hindrance, respectively), whereas the arrows show the direction at which p58C is pushing p58N. Close-up view of the complex in panel 9, explaining how steric hindrance is avoided, is provided in Fig. 10B. The image on the right shows the typical pattern of primase-catalyzed reaction products.

