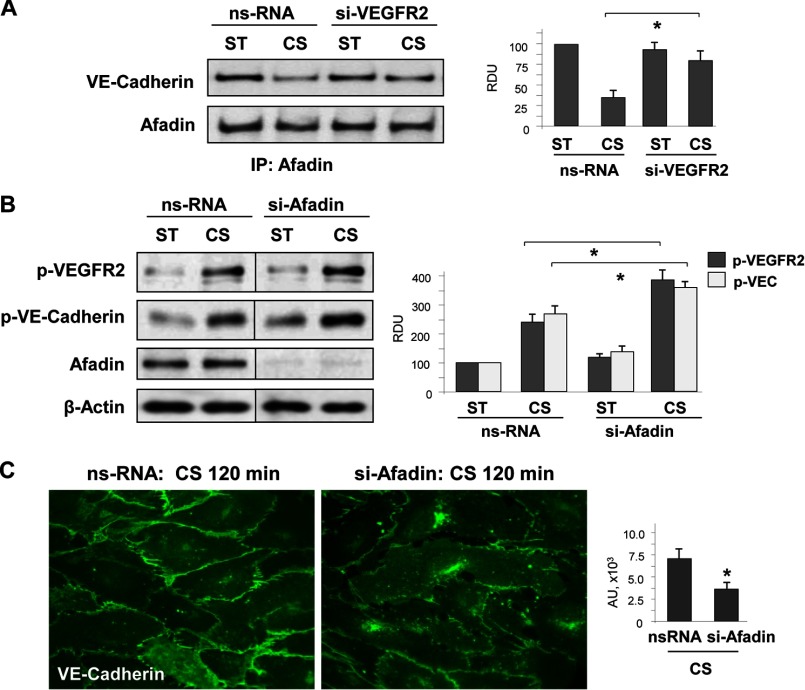
FIGURE 8.
Effect of afadin depletion on VE-cadherin and VEGFR2 association phosphorylation EC monolayer recovery under 18% CS. A, HPAEC transfected with VEGFR2-specific or nonspecific siRNA were left static (ST) or exposed to 18% CS (120 min). Afadin association with VE-cadherin in static and 18% CS-stimulated EC was evaluated by co-immunoprecipitation assay using afadin antibody. n = 3; *, p < 0.05 versus ns-RNA. B and C, EC were transfected with afadin-specific or nonspecific siRNA, followed by 18% CS stimulation. Control cells were left under static conditions. B, effect of afadin knockdown on CS-induced (15 min) VEGFR2 and VE-cadherin tyrosine phosphorylation. siRNA-induced protein depletion was confirmed by Western blot. β-Actin was used as a normalization control. n = 3; *, p < 0.05 versus ns-RNA. C, effect of afadin knockdown on 18% CS-induced (120 min) adherence junction remodeling was evaluated by immunofluorescence staining of EC monolayers with VE-cadherin antibody. The bar graph represents quantitative analysis of VE-cadherin peripheral accumulation. The data are expressed as means ± S.D. of three independent experiments. *, p < 0.05 versus ns-RNA. IP, immunoprecipitation.

