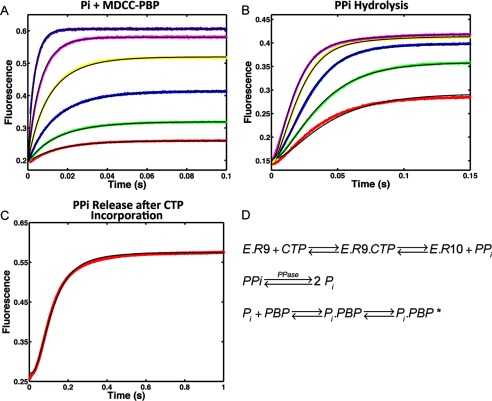
FIGURE 6.
Kinetics of PPi release after CTP (10-mer) incorporation by NS5B elongation complex. A, calibration of Pi binding to MDCC labeled PBP. Reactions containing 0.1, 0.2, 0.4, 0.8, 1.6, and 3.2 μm Pi were reacted against 0.5 μm PBP. The fluorescence signal was monitored by stopped-flow at 30 °C for 0.1 s. B, kinetics of PPi hydrolysis by yeast inorganic PPase was determined by incubating 0.2, 0.4, 0.8, 1.6, and 3.2 μm PPi with 0.6 μm PPase and 0.5 μm MDCC-PBP. After PPi was hydrolyzed by PPase into Pi and captured by PBP, the fluorescence signal was measured at 30 °C for 0.15 s. C, 200 μm CTP was introduced as the incoming nucleotide at 10-mer position for HCV elongation complex (200 nm). The PPi release signal after CTP incorporation was measured in the presence of 0.6 μm PPase and 0.5 μm MDCC-PBP at 30 °C for 1 s. The experiment was repeated for NNI2-bound HCV elongation complex. All experiments were globally fitted to Panel D using KinTek Explorer to determine rate constants summarized in Table 1. D, scheme showing the method for measuring PPi release using hydrolysis by PPase and the binding of Pi to the fluorescently labeled PBP.

