FIGURE 1.
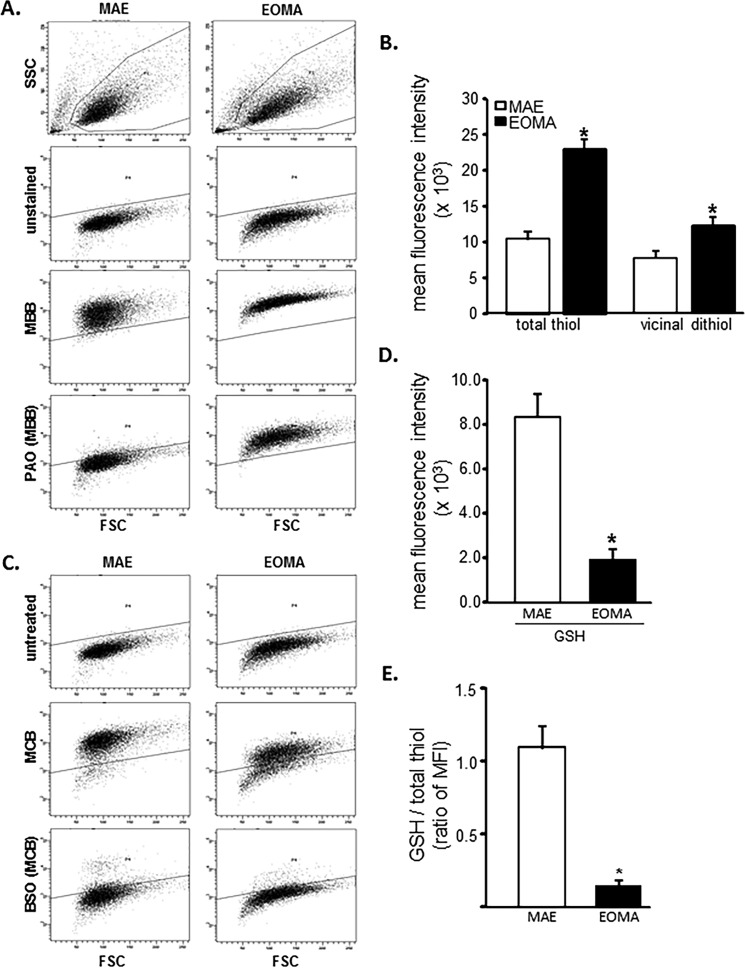
EOMA cells have elevated total thiol pool and depleted GSH compared with MAE. A, flow cytometry was used on MAE and EOMA cells to detect the total thiol pool using (40 μm) MBB, and pretreatment with 20 μm PAO was used to identify the portion of total thiols consisting of vicinal dithiols. Threshold detection of autofluorescence from unstained cell population is indicated by the solid line. B, quantification of flow cytometry mean fluorescence intensity (MFI) demonstrates increased thiol pool in EOMA compared with MAE cells. Here total thiol intensity (MBB) was measured by subtracting the autofluorescence level (mean intensity of total MBB − intensity of unstained samples = total thiol signal), and vicinal thiol was measured by subtracting PAO-sensitive thiol (mean intensity of total MBB − PAO-sensitive MBB intensity = vicinal dithiol signal) from total thiol (MBB). C, flow cytometry detection of GSH pools in MAE and EOMA was done by using (40 μm) MCB and pretreating cells with 150 μm BSO for 18 h and then loading with MCB. BSO depletes GSH, so the residual MCB staining cells after pretreatment with BSO represent the low molecular weight thiols other than GSH. D, the bar graph represents flow cytometry quantification of mean fluorescence intensity (absolute values) generated in the presence of MCB. GSH is calculated as mean intensity of total MCB − BSO-sensitive MCB intensity = GSH signal, as described in our previous work (29). E, the fluorescence intensity ratio of total GSH pool to total thiol pool as described is significantly less in EOMA versus MAE cells. Results are expressed as mean ± S.D. (error bars); *, p < 0.05.

