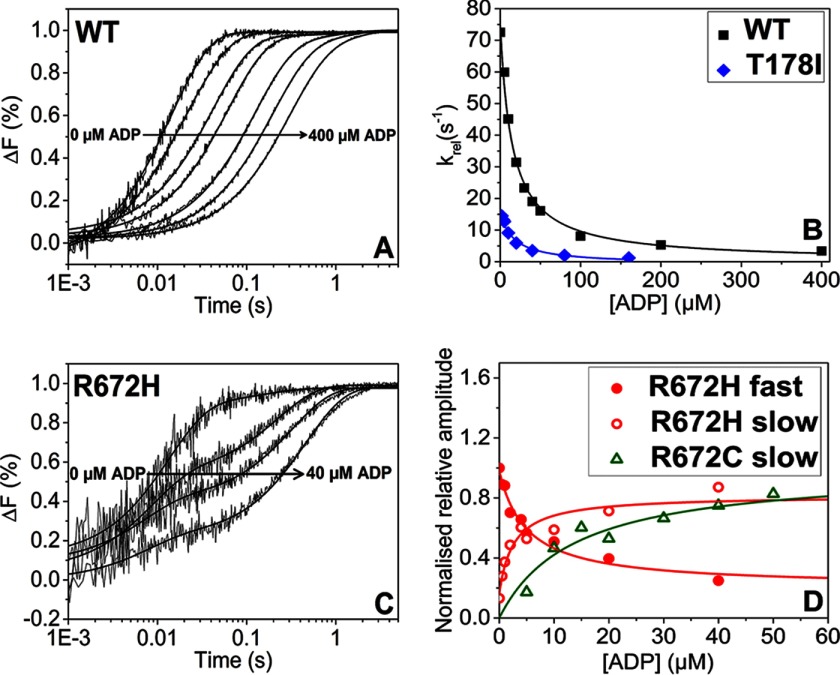
FIGURE 4.
ADP affinity for pyrene-labeled actin-S1. A, fluorescent traces of 50 nm pyrene-labeled actin preincubated with 50 nm WT MyHC-emb and increasing [ADP] (0–400 μm) rapidly mixed with 10 μm ATP. As the [ADP] increased, the kobs decreased from 72 to 3 s−1. B, the dependence of kobs on [ADP] for WT MyHC-emb (squares) and T178I (circles), resulting in a K′5 = 16 ± 1.5 and 17 ± 4 μm, respectively. C, traces of 50 nm pyrene-actin preincubated with 50 nm R672H S1 and increasing [ADP] (0–40 μm) rapidly mixed with 30 μm ATP. Because there was a consistent slow phase even at low [ATP], the rates stayed constant while the amplitude of the fast phase decreased from 26 to 6% and the slow phase amplitude increased from 3.5 to 21%. This behavior was also seen in the R672C mutation. D, dependence of fluorescence amplitude of [ADP] for R672H and R672C. K′5 = 2.6 ± 1.1 μm for the fast phase and K′5 = 5 ± 1.3 μm for the slow phase for R672H. K′5 = 16.3 ± 3.6 μm for the fast phase (not shown) and 13.6 ± 2.6 μm for the slow phase.

