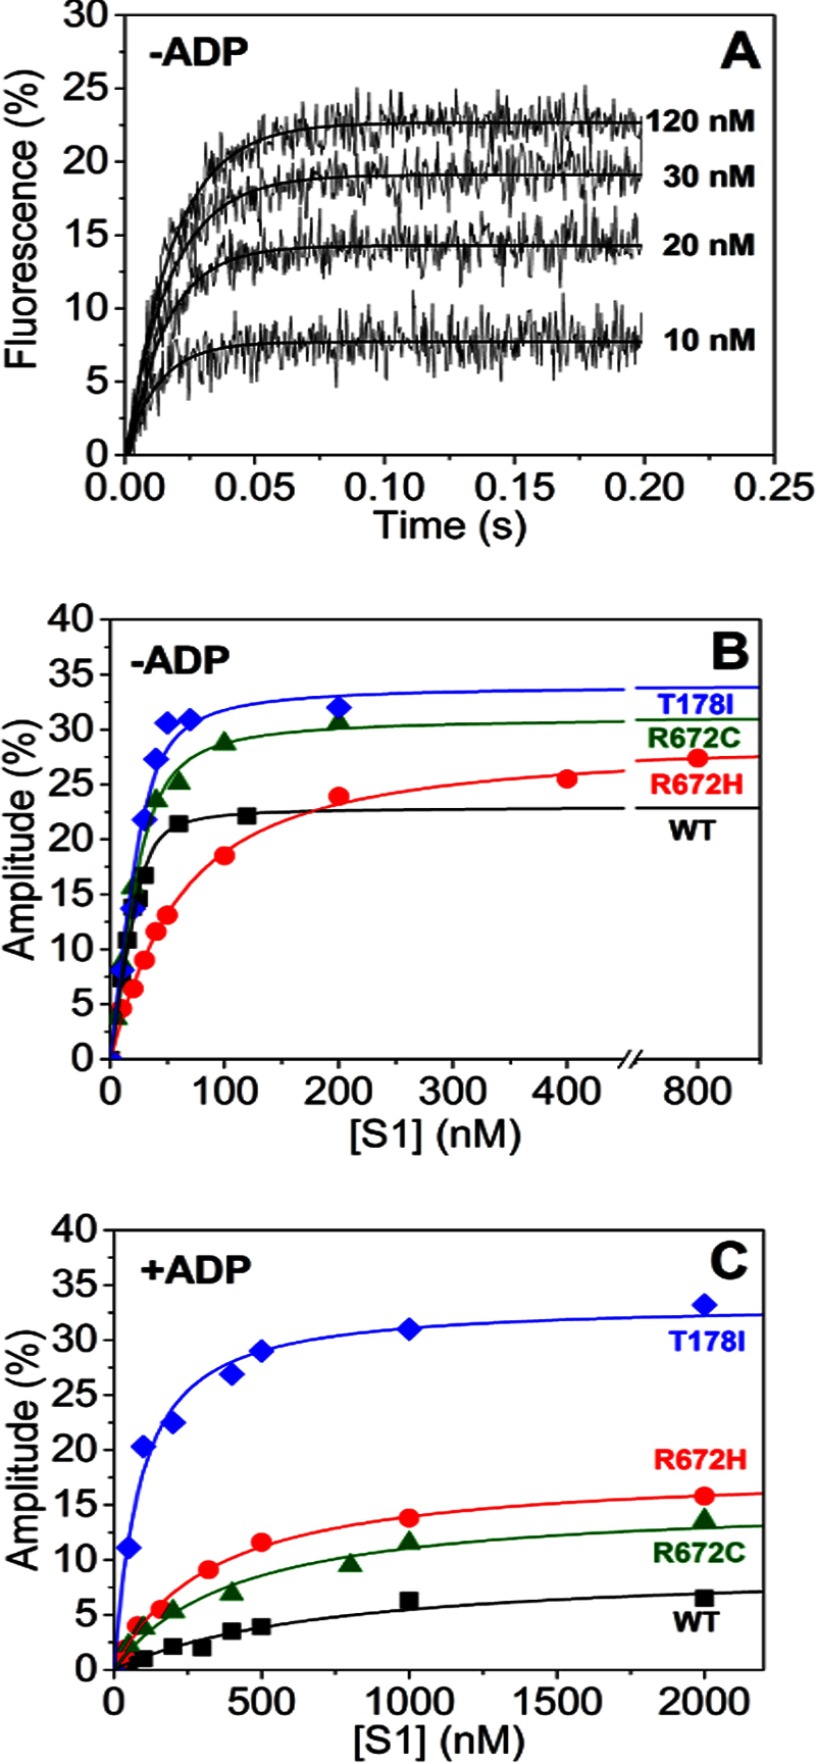
FIGURE 5.
Embryonic S1 affinity for actin in the absence and presence of ADP. A, traces of increasing concentrations (0 μm to 120 nm) of WT MyHC-emb preincubated with 30 nm pyrene-labeled actin and then rapidly mixed with 10 μm ATP. Over a concentration series, the fluorescence amplitude increased with [S1]. B, the dependence of amplitude on [S1] can be described by a quadratic function (Equation 6), giving a KA value of 2.5 nm for WT MyHC-emb (filled squares), 43 nm for R672H (open squares), 6.1 nm for R672C (filled circles), and 5.2 nm for T178I (open circles). C, repeating the same experiment but this time incubating the actin-S1 with saturating (20 × K′5) [ADP]. Plotting the amplitude against the [S1] again gives a quadratic dependence, which in turn gives a KDA value of 706 nm for WT MyHC-emb (filled squares), 306 nm for R672H (open squares), 386 nm for R672C (filled circles), and 71 nm for T178I (open circles). Concentrations of S1 are before mixing.

