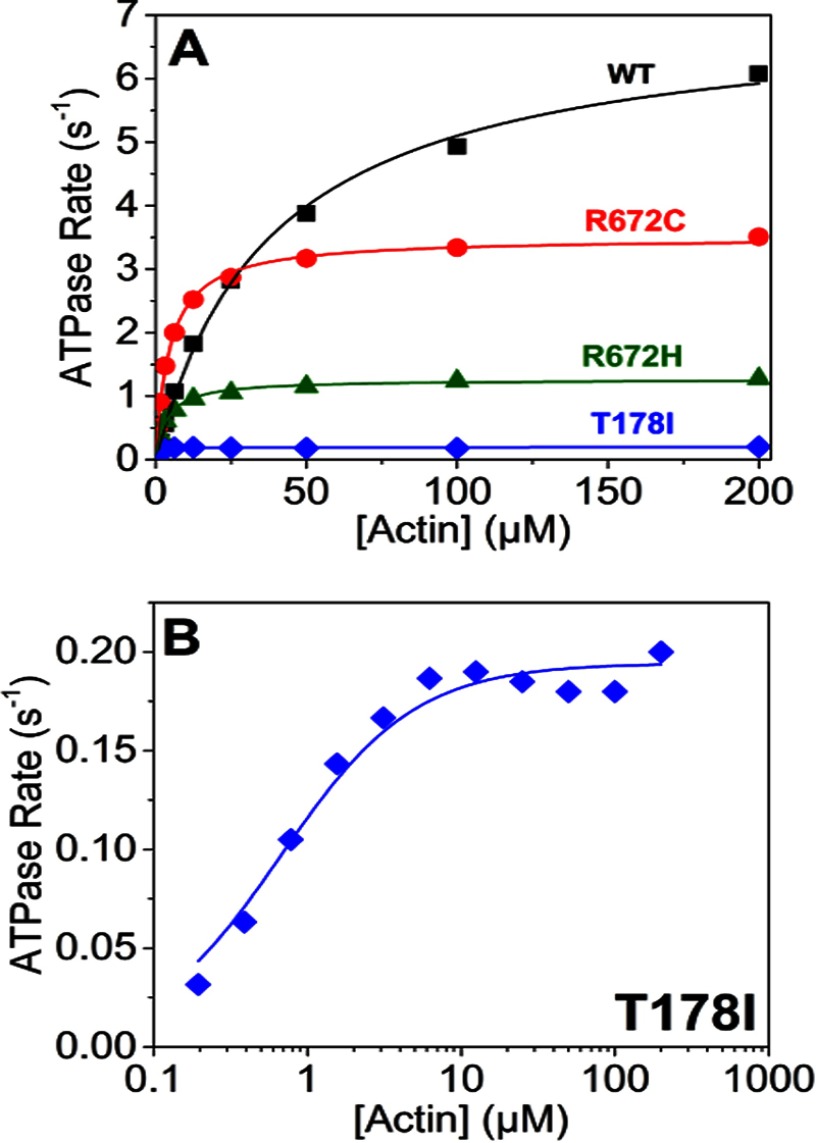
FIGURE 7.
ATPase assays of the WT MyHC-emb and the three FSS mutations. A, actin activation of the S1 ATPases with best fit Michaelis-Menten curves superimposed on the data points. These fits gave a Vmax = 7.0 s−1 for WT MyHC-emb and a Km = 38.5 μm (filled squares). The R672H (filled circles) had a Vmax = 1.3 s−1 and a Km = 3.7 μm; R672C (open squares) had a Vmax = 3.5 s−1 and a Km = 4.6 μm; and T178I (open circles) had a Vmax = 0.2 s−1 and a Km = 0.7 μm. B, the ATPase assay of the T178I mutant on a log time scale to highlight the T178I fit to a Michaelis-Menten function despite a small activation by actin. Results plotted are from two protein preparations with 3–4 technical replicates each time.

