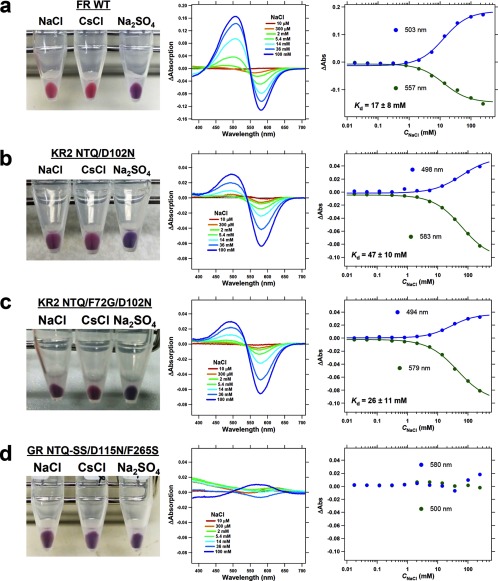
FIGURE 7.
Cl− concentration dependence of absorption spectra of rhodopsins having the NTQ motif reporting on chloride binding. The picture of E. coli cells in 100 mm NaCl, CsCl, and Na2SO4 (left), difference UV-visible absorption spectra upon the addition of NaCl of different concentrations (middle) and the titration curve for the absorption change at the peak wavelength shown in the difference spectra (right) for FR WT (a), KR2 NTQ/D102N (b), KR2 NTQ/F72G/D102N (c), GR NTQ-I83S/H87S(SS)/D115N/F265S (d). Solid lines in the titration curve indicate the fitting curves using a Hill equation and calculated dissociation constant of Cl− (Kd) is shown in the graph.

