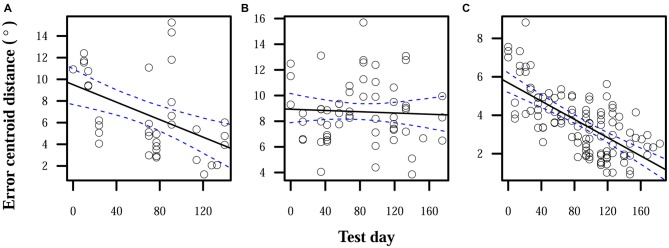
Figure 1.
Reduction in localization error when auditory feedback was present. Data points each represent the error centroid distance from the origin for one trial run. Regression lines are shown for each distribution of centroid distances over time. 95% confidence bands are shown with dashed lines. (A) S1: slope = −0.04°/day, intercept = 9.5°. (B) S2: slope = −0.002°/day, intercept = 8.9°. (C) S3: slope = −0.02°/day, intercept = 5.7°.

