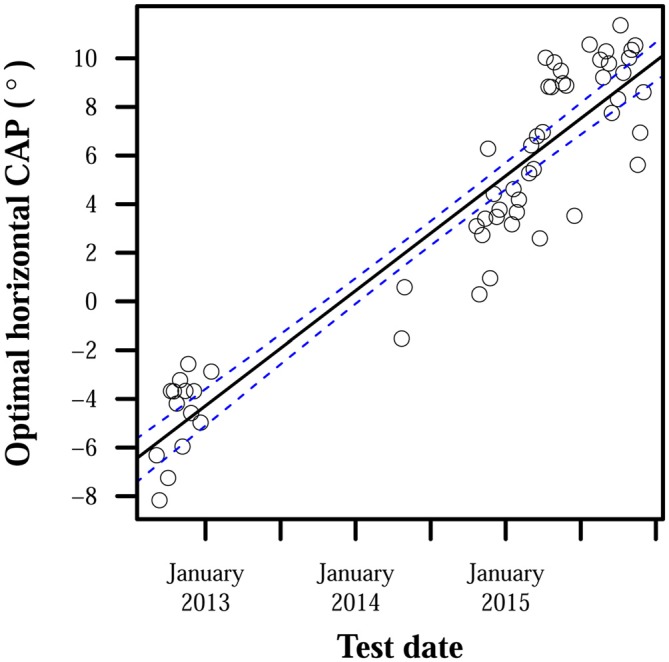
Figure 3.

Optimal horizontal camera alignment positions (CAPs) for S3 over time. Positive ordinate values indicate rightward eccentricity in the camera’s visual field, and negative values indicate leftward eccentricity. Points each represent optimal horizontal CAP estimates averaged over all trials on 1 day. S3’s camera was intentionally misaligned during the period between January 2013 and April 2014, and collected data were therefore unsuitable for estimating S3’s optimal CAP. The line of best fit has a slope of 0.01°/day and intercept of −5.8°. The line’s 95% confidence bands are shown with dashed lines.
