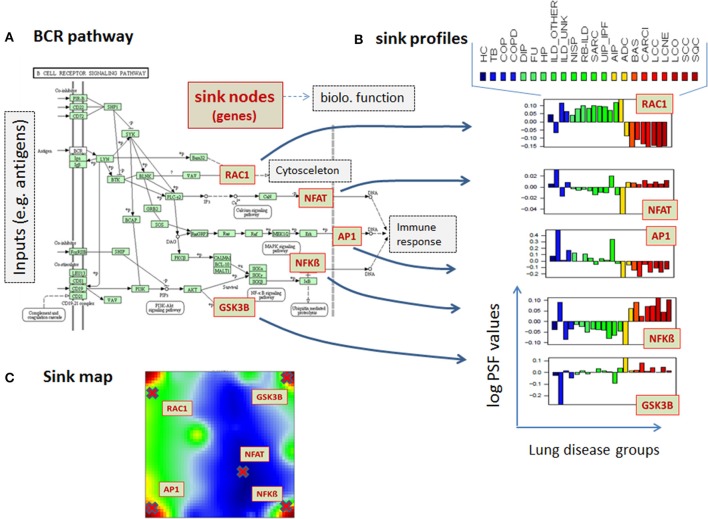
Figure 2.
PSF-profiles of the KEGG B cell signaling (BCR) pathway. (A) Red nodes in the BCR pathway represent pathway sinks. Their PSF values are shown in part (B) for all disease classes studied (see Table 1 for assignments). PSF values depend on the gene expression of the genes upstream from the sink nodes (green boxes in the pathway) which change in a disease specific fashion. (C) The location of the sink node genes in the summary SOM map.

