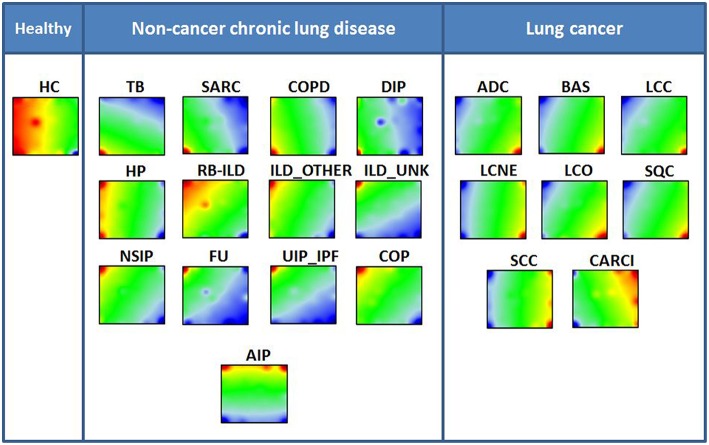
Figure 3.
Disease specific SOM portraits. Each lung disease and healthy control is characterized by its PSF portrait visualizing the pathway activities. The diseases are sorted into three groups. The color key for the summary SOM portrait is blue-yellow-red, where blue colors represent lowest values, green-yellow transition includes intermediate values and the red colors represent highest values. Note the marked difference between groups, especially between cancer and chronic lung diseases.

