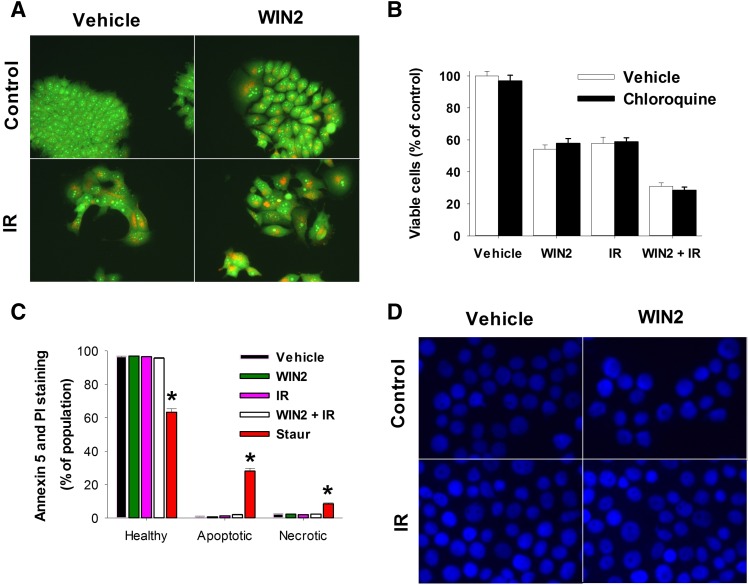
Fig. 6.
Assessment of apoptosis, necrosis, and autophagy induction by WIN2. MCF-7 cells were treated as in Fig. 3. (A) Autophagy induction by acridine orange staining. Images were taken at 96 hours and 40× magnification. (B) Autophagy induction in the absence and presence of chloroquine. (C) Flow cytometry at 48 hours for Annexin V and propidium iodide staining. Staurosporine (1 µM, 24 hours) was used as a positive control. (D) DAPI staining for nuclear morphology at 48 hours using 40× magnification. Data were normalized to percentage of control in (B) and percentage of population in (C); data presented reflect the means of three or four individual experiments ± S.E.; *P < 0.05 versus vehicle.

