
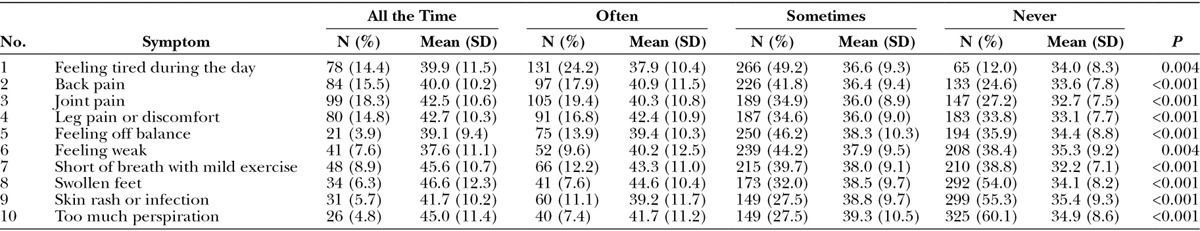
Table 6.
Number (%) of Participants to Endorse Each Response Category of the Symptom Checklist and the Mean (SD) Value for BMI for Each Category and 1-way ANOVA P Value
Official websites use .gov
A
.gov website belongs to an official
government organization in the United States.
Secure .gov websites use HTTPS
A lock (
) or https:// means you've safely
connected to the .gov website. Share sensitive
information only on official, secure websites.
Number (%) of Participants to Endorse Each Response Category of the Symptom Checklist and the Mean (SD) Value for BMI for Each Category and 1-way ANOVA P Value