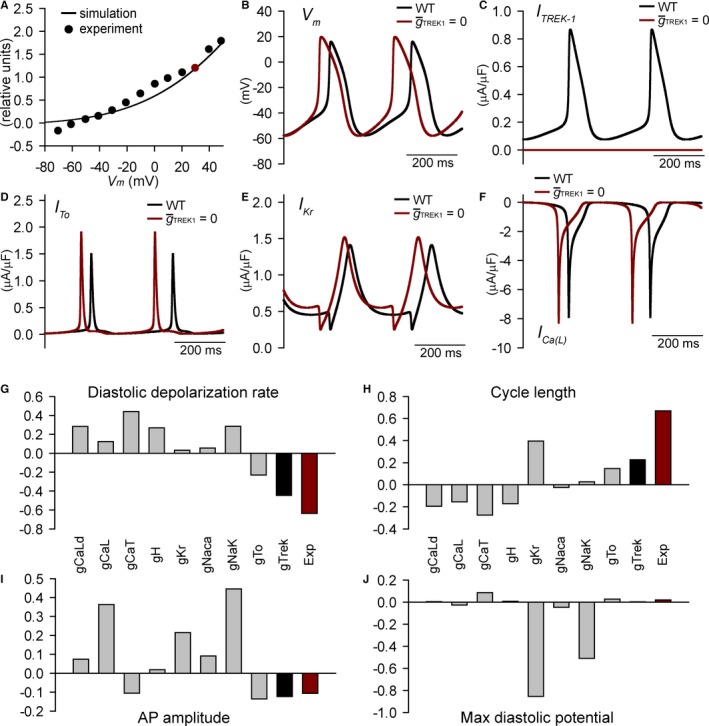
Figure 8.

Mathematical model of spectrin/TREK‐1 dysfunction and abnormal sinoatrial node cell excitability. A, Simulated and experimentally measured37 TREK‐1 current‐voltage relationship. Current was normalized to 1.2 μA/μF at +30 mV in agreement with difference in background K+ current measured between WT and Kcnk2 −/− sinoatrial node cells. B through F, Simulated spontaneous APs, TREK‐1 current, transient outward K+ current (I to), rapid delayed rectifier K+ current (IK r), and L‐type Ca2+ current (IC a(L)) in the control model (black lines) or with maximal TREK‐1 conductance () set to zero (red lines). G through J, Regression coefficients indicating how changes in model parameters affect AP properties. Also shown are predicted regression coefficients for perturbation (5‐SD decrease in single parameter) that would produce experimentally measured changes in qv 4J AP properties (red bars). AP indicates action potential; gCaL, L‐type Ca2+ channel Cav1.2; gCaLd, L‐type Ca2+ channel Cav1.3; gCaT, T‐type Ca2+ channel; gH, funny current; Exp, experimental; gKr, Rapid delayed rectifier K+ current; gNaca, Na+/Ca2+ exchanger velocity; gNaK, Na+/K+ ATPase transport rate; gTo, transient outward K+ current; max, maximum; WT, wild type.
