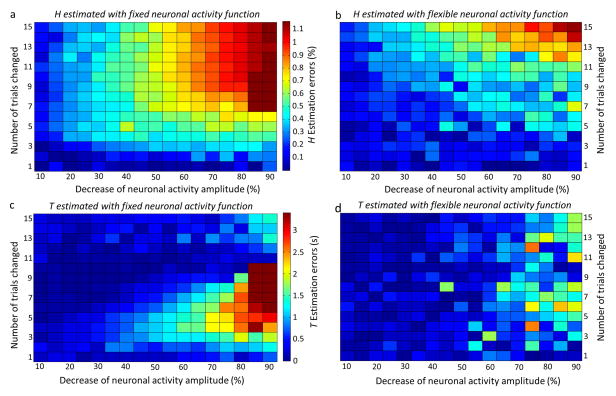
Fig. 2.
Pseudocolor plots of the estimation errors of HRF characteristics H (a, b) and T (c, d). The amplitude of the neuronal activity function was decreased in 5% increments between 10% and 90% of activity (represented by the horizontal axis). The number of trials in each block affected by the change in amplitude was varied from the first trial in each block to the first 15 of a total of 16 trials in each block (represented by the vertical axis). The absolute differences between the estimated HRF characteristics and the true values were color-coded: the color bars represent estimation errors in H between 0 and 1.2% (a and b) and in T between 0 s and 3.4 s (c and d). (a) and (c) respectively represent the estimation errors of HRF H and T using the fixed neuronal activity function. (b) and (d) respectively represent the estimation errors of HRF H and T using the flexible neuronal activity function. Overall, HRF H and T are estimated more accurately when a flexible as opposed to a fixed neuronal activity function is used. While HRF modeling with a flexible neuronal activity function improved the accuracy of HRF estimation when neuronal activity varied, errors in the estimation of T are not seen if the change in the amplitude of actual neuronal activity is less than 50%.

