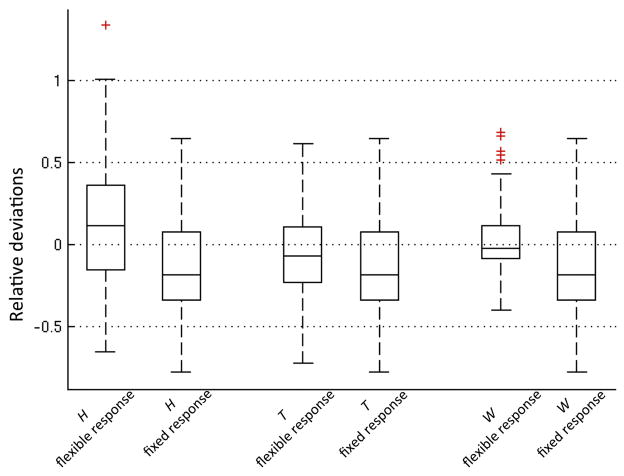
Fig. 3.
Box-and-whisker plot comparing the relative deviations of estimated HRF characteristics from the true values when flexible versus fixed neuronal activity functions were used. Outliers (red cross) were defined as exceeding 3 times the standard deviation; all data, including outliers without Winsorization, were considered in the analysis. The HRF characteristics estimated with the flexible neuronal activity function are more accurate (less deviation from the true values and smaller interquartile range) than those estimated using a fixed neuronal activity function.

