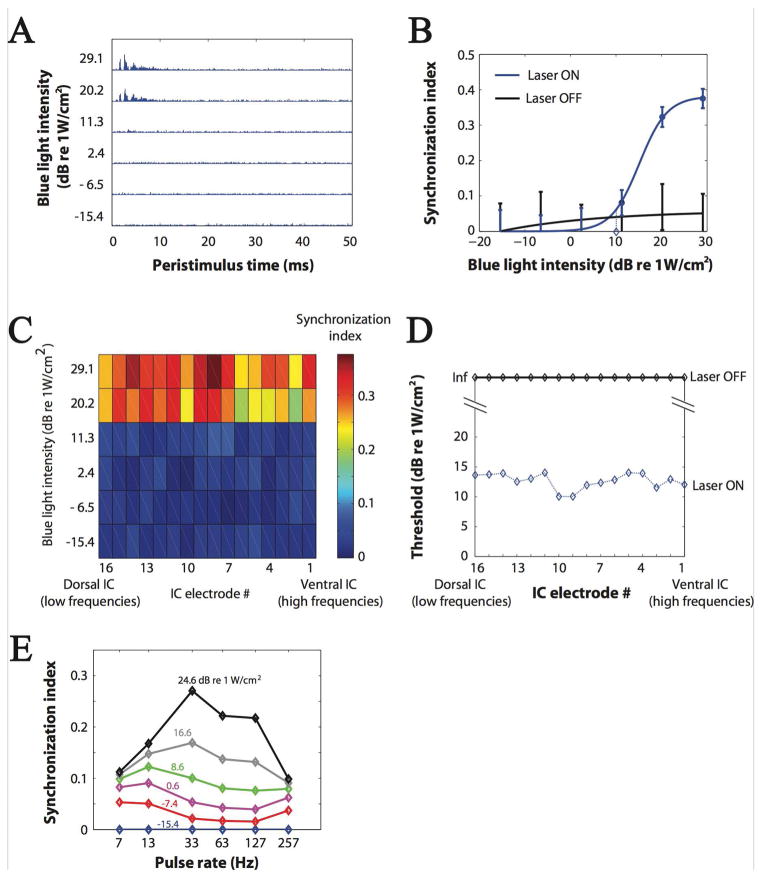
Figure 3.
Analysis of synchronization in IC in ChR2+ cases (A–D: KND 23; E: KND 37). A) A clear response near stimulus onset at the largest stimulus intensities is observed in poststimulus time histograms (5000 bins, electrode #8, 5 Hz pulse rate, 1-ms duration light pulses). B) Synchronization index (SI) in same electrode (blue dots are means, error show ± 2 standard deviations, blue line: sigmoidal fit). The SI threshold was near 10 dB re: 1W/cm2 (blue diamond) and it approached saturation at 30 dB re: 1W/cm2. Black points show laser OFF condition. C) SI mapping as a function of intensity for all electrodes. D) Synchronization thresholds as a function of IC electrode. Thresholds were defined as the light intensity at which SI was significant (Rayleigh test, p<0.01). E) SI as a function of pulse rate at different light intensities (from electrode #14, with best response to sound frequency of 16 kHz). At the higher light intensities, SI rolls off at pulse rates above 60 Hz.

