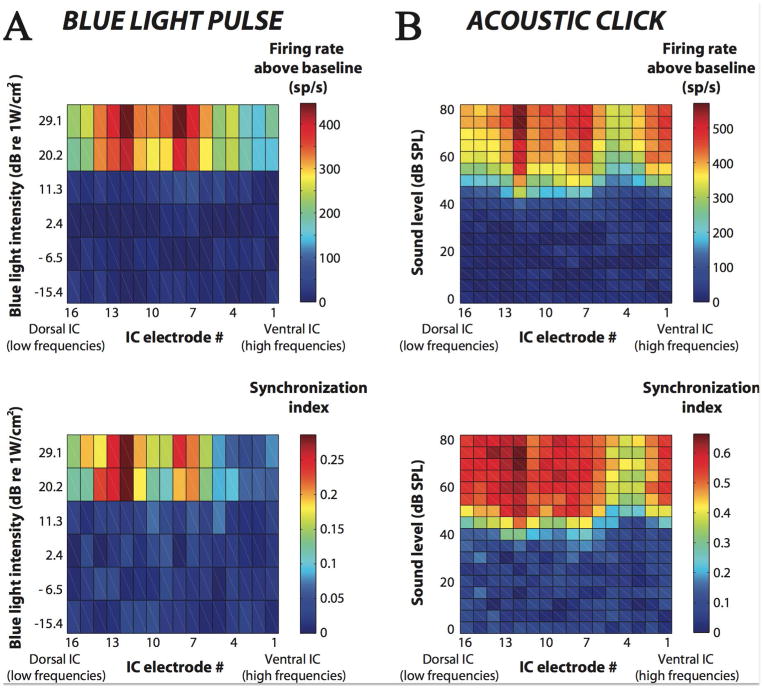
Figure 6.
Comparison of IC responses between optical and acoustic stimulation in a ChR2+ mouse (KND 21). A) Activation maps in response to 1 ms duration blue light pulses presented at a rate of 5 Hz (80 presentations). Top: Average firing rate and bottom: SI both show broad activation with thresholds in the 10 to 20 dB re: 1W/cm2 range. B) Activation maps in response to 0.1 ms duration acoustic clicks presented at a rate of 23 Hz (80 presentations) for sound levels ranging from 0 to 80 dB SPL. Top: Average firing rate and bottom: SI. Both measures show broad activation with thresholds in the 40 to 60 dB SPL range.

