Figure 7.
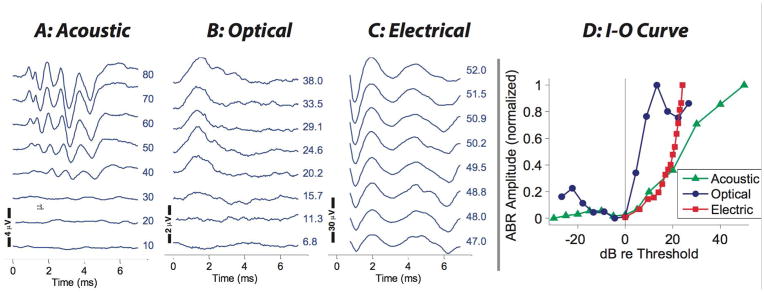
Acoustic, optical, and electrical evoked potentials (KND 38). A) Waveforms from an acoustically evoked ABR recorded in response to different levels of a 23 Hz 1-ms stimulus (512 repetitions). B) Waveforms of the optically evoked ABR recorded with a 1-ms 23 Hz blue light pulse presented 500 times to the CN. C) Electrically evoked ABR in the same animal with a level series using a 200 μs electrical pulse presented at 27 Hz with 100 repetitions. D) Input-output (I–O) curves showing a roughly similar shape for the three types of stimulation. Normalized baseline to peak output (μV) was used.

