
Figure 3.
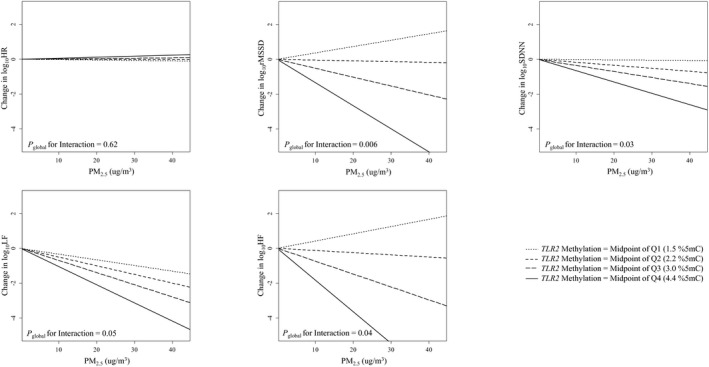
The effect of particulate matter with aerodynamic diameter <2.5 μm (PM 2.5) exposure on heart rate variability (HRV) at different mean Toll‐like receptor 2 (TLR2) methylation levels, Normative Aging Study, 2000–2011 (N=500). log10 HR indicates log10‐transformed heart rate; log10rMSSD, log10‐transformed root mean square of the successive differences; log10 SDNN, log10‐transformed standard deviation of normal‐to‐normal intervals; log10 LF, log10‐transformed low‐frequency power (0.04 to 0.15 Hz); log10 HF, log10‐transformed high‐frequency power (0.15 to 0.4 Hz); Q1, Q2, Q3, and Q4 indicate the first, second, third, and fourth quartiles. The association of PM 2.5 with rMSSD, SDNN, LF, and HF is modified by mean TLR2 methylation levels, as indicated by the different slopes. The 4 lines in each figure represent the relationship between PM 2.5 and HRV when the mean TLR2 methylation level is at the midpoints of each quartile. If there was no effect modification, the 4 lines would be the same. The P global for interaction was based on a global test for effect modification by position‐specific methylation. Interaction terms between each of the 5 TLR2 positions and PM 2.5 were included in the model, and these 5 interaction terms were tested jointly for effect modification using a Wald test (global test). Results were adjusted for age; body mass index; fasting glucose level; hypertension; smoking status; alcohol consumption; physical exercise; household income; the use of calcium channel blocker, β‐blocker, and angiotensin‐converting enzyme inhibitor; room temperature; outdoor apparent temperature; season; weekday; and visit date.