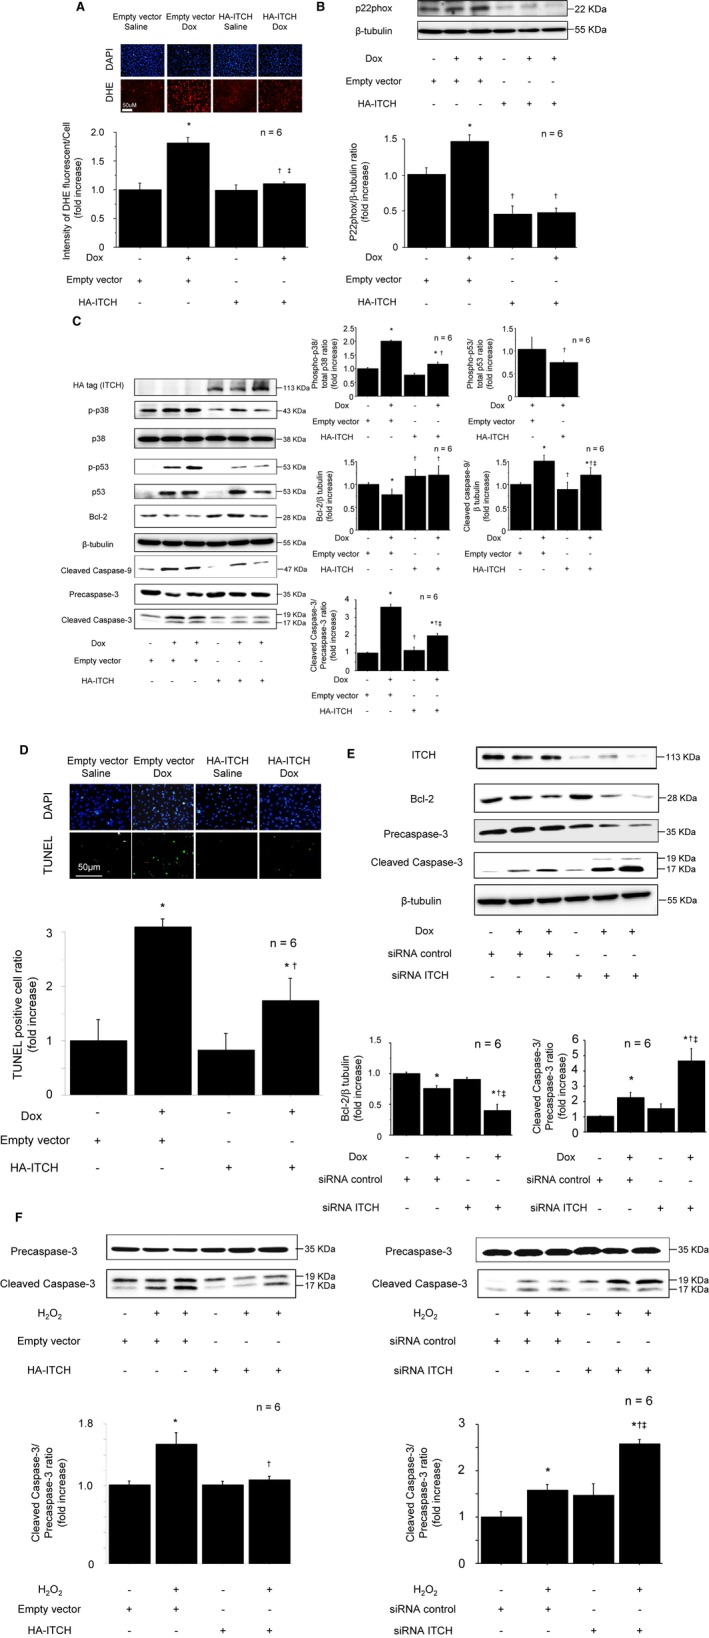
Figure 4.

ITCH‐dependent TXNIP degradation ameliorated oxidative stress and cardiomyocyte apoptosis in reactive oxygen species–induced cardiotoxicity. A, Intensity of DHE staining after Dox stimulation (0.5 μmol/L, 12 hours). B, ITCH overexpression in cardiomyocyte inhibited NADPH oxidase subunit p22phox. C, Representative Western blots of p38 MAPK, p53, Bcl‐2, cleaved caspase‐9, and cleaved caspase‐3 in HA‐ITCH‐transfected cardiomyocytes after Dox stimulation (0.5 μmol/L, 12 hours). D, Inhibition of TUNEL‐positive cells by overexpression of HA‐ITCH after Dox stimulation (0.5 μmol/L, 12 hours). Data are expressed as mean±SEM (n=6 per group, *P<0.05 vs control with empty vector, † P<0.05 vs Dox stimulation with empty vector, ‡ P<0.05 vs control with HA‐ITCH vector). E, Representative Western blots of Bcl‐2 and cleaved caspase‐3 in siRNA ITCH‐transfected cardiomyocytes after Dox stimulation (0.5 μmol/L, 12 hours). Data are expressed as mean±SEM (n=6 per group, *P<0.05 vs siRNA control, † P<0.05 vs siRNA control with Dox stimulation, ‡ P<0.05 vs control with siRNA ITCH). F, Representative Western blot of cleaved caspase‐3 after H2O2 stimulation. Left: ITCH overexpression, n=6 per group, *P<0.05 vs control with empty vector, † P<0.05 vs H2O2 stimulation with empty vector. Right: ITCH knockdown using siRNA, n=6 per group, *P<0.05 vs siRNA control, † P<0.05 vs siRNA control with H2O2 stimulation, ‡ P<0.05 vs control with siRNA ITCH. Dox indicates doxorubicin; HA, pRK5‐hem agglutinin; H2O2, hydrogen peroxide; siRNA, small interfering RNA; TUNEL, terminal deoxynucleotidyl‐transferase‐mediated 2′‐deoxyuridine‐5′‐triphosphate nick‐end labeling; TXNIP, thioredoxin‐interacting protein.
