
Figure 6.
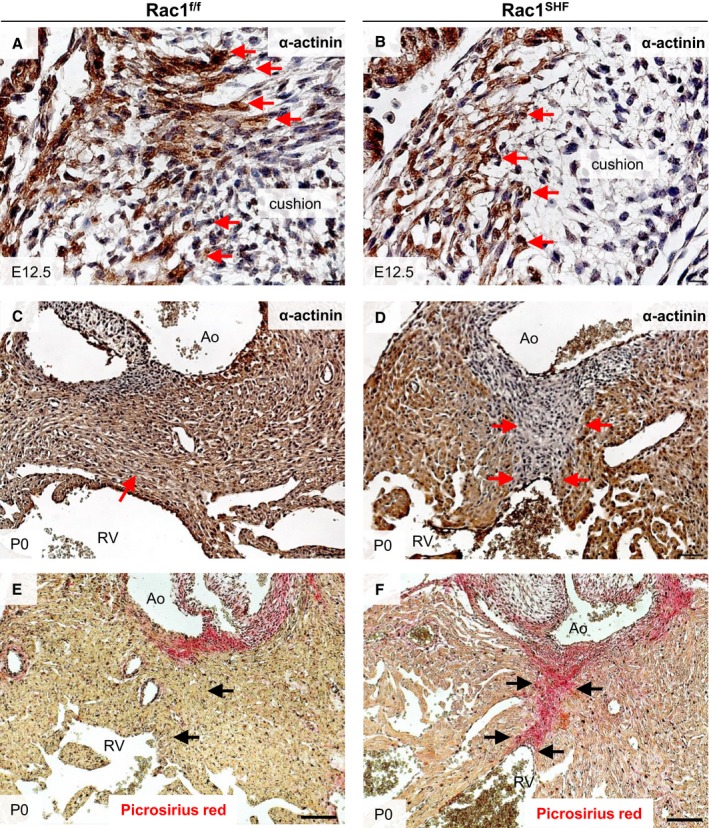
Abnormalities in Rac1 SHF OFT myocardialization. E12.5 Rac1 SHF OFT cardiomyocytes, marked by α‐actinin immunostaining (B), exhibited a blunted morphology instead of a polarized morphology and did not extend as far into the OFT cushions compared with controls (A). Red arrows indicate invading cardiomyocytes. The proximal OFT septum remained nonmuscularized in P0 Rac1 SHF hearts (D), indicated by an absence of α‐actinin staining (arrows in D) compared with control (C), in which the septum is muscularized (arrow in C). The nonmuscularized proximal OFT septum in Rac1 SHF hearts (F) stained positive for picrosirius red (arrows in F), indicating that this tissue remained mesenchymal compared with controls (E), which had become muscularized (arrow in E). n=3 for each staining per group. Scale bars: 10 μm (A and B), 50 μm (C through F). Ao indicates aorta; E, embryonic day; OFT, outflow tract; RV, right ventricle; SHF, second heart field.