
Figure 1.
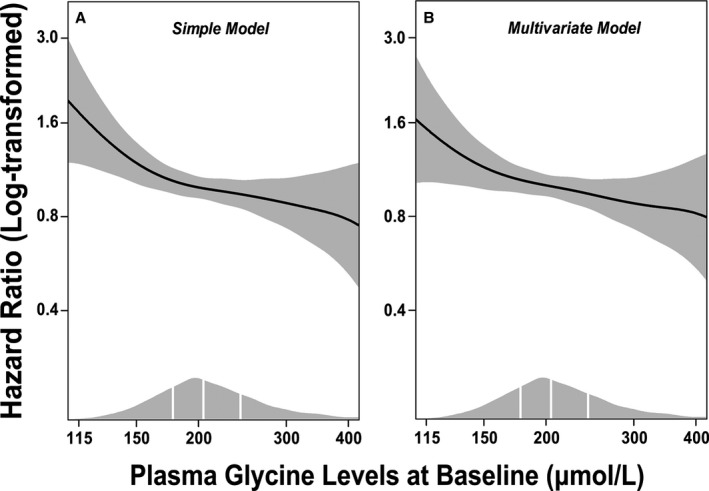
Dose–response associations between (log‐transformed) plasma glycine and risk of acute myocardial infarction. Generalized additive regressions are used with the adjustment for age and sex in the simple model (A), and additional adjustment for smoking, obesity, hypertension, diabetes mellitus, angiographic extent of coronary artery disease (ordinal), estimated glomerular filtration rate, apolipoprotein A‐1, apolipoprotein B, and statin treatment in the multivariate model (B). The solid lines and the shaded areas represent hazard ratios of plasma glycine and their 95% CI, respectively. The areas under the curve along the X‐axes represent the distributions of the plasma glycine concentrations (μmol/L) in the total population. The vertical white lines denote the 25th, 50th, and 75th percentiles of plasma glycine, respectively.