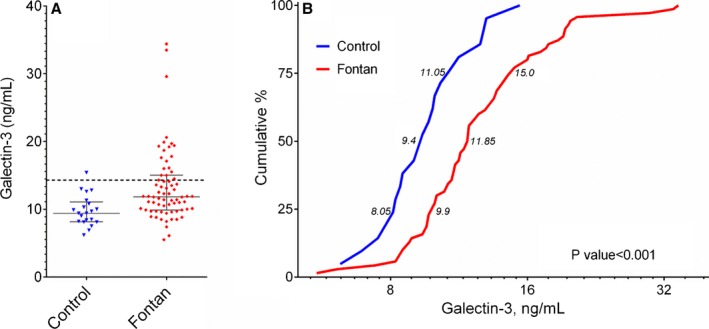
Figure 1.

Distribution of galectin‐3 values for Fontan participants and an age‐ and sex‐matched control group. A, Absolute galectin‐3 values for Fontan participants and the control group; the error bars represent the 25th to 75th percentiles. The dashed line designates 14.3 ng/mL, the cutoff used to define elevated galectin‐3 in this study. B, Cumulative distribution of galectin‐3 for control and Fontan participants, logarithmic scale. Numbers adjacent to respective curves designate the median value bounded by the first and third quartiles. The Wilcoxon rank sum test was used to compare galectin‐3 level between groups.
