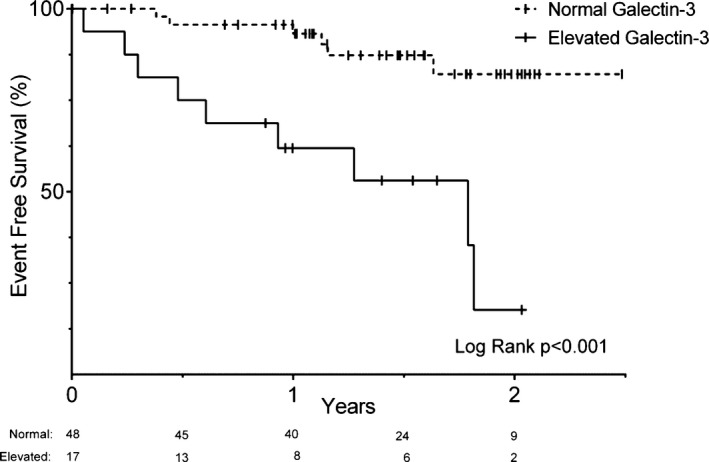
Figure 3.

Kaplan–Meier plot of event‐free survival stratified by galectin‐3 level ≤14.3 or >14.3 ng/mL. A Kaplan–Meier plot of risk in each group from time of blood draw is listed below the graph; hash marks designate censored observations. Event‐free survival refers to survival without nonelective cardiovascular or Fontan‐related hospitalization. Number of participants at risk in each group is listed below the x‐axis. A small subset of participants (3 of 51 and 2 of 19 in the normal and elevated galectin‐3 groups, respectively) had no follow‐up time.
