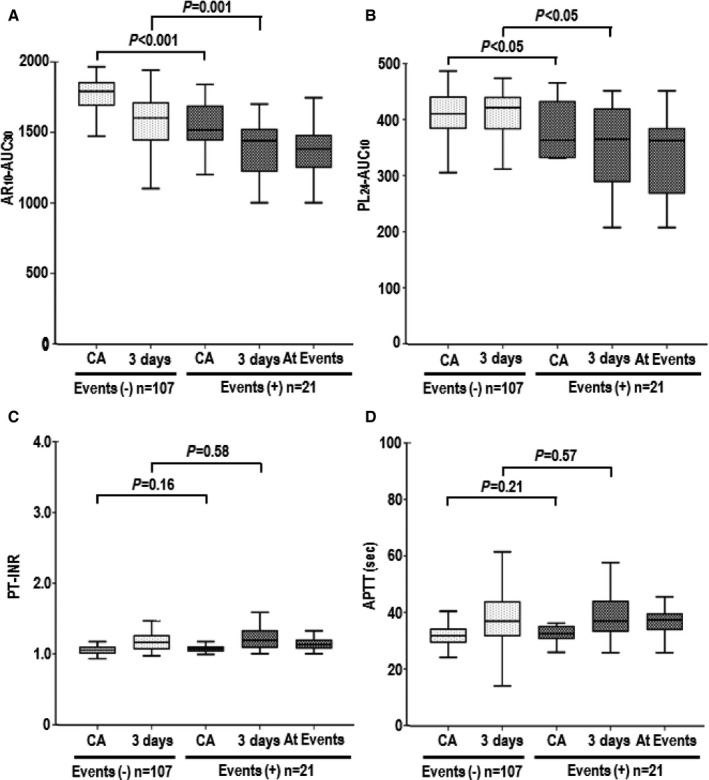
Figure 3.

Serial changes in T‐TAS parameters, PT‐INR, and APPT in atrial fibrillation patients with (+) and without (−) bleeding events: AR 10‐AUC 30 (A), PL 24‐AUC 10 (B), PT‐INR (C), and APTT (D) levels. Box‐and‐whisker plots are described in Figure 2. 3 days indicates 3 days after catheter ablation; APTT, activated partial thromboplastin time; AR10‐AUC30, area under the curve for the first 30 minutes for the atheroma chip tested at flow rate of 10 μL/min; CA, catheter ablation; PL24‐AUC10, area under the curve for the first 10 minutes for the platelet chip tested at flow rate of 24 μL/min; PT‐INR, prothrombin time international normalized ratio.
