
Figure 4.
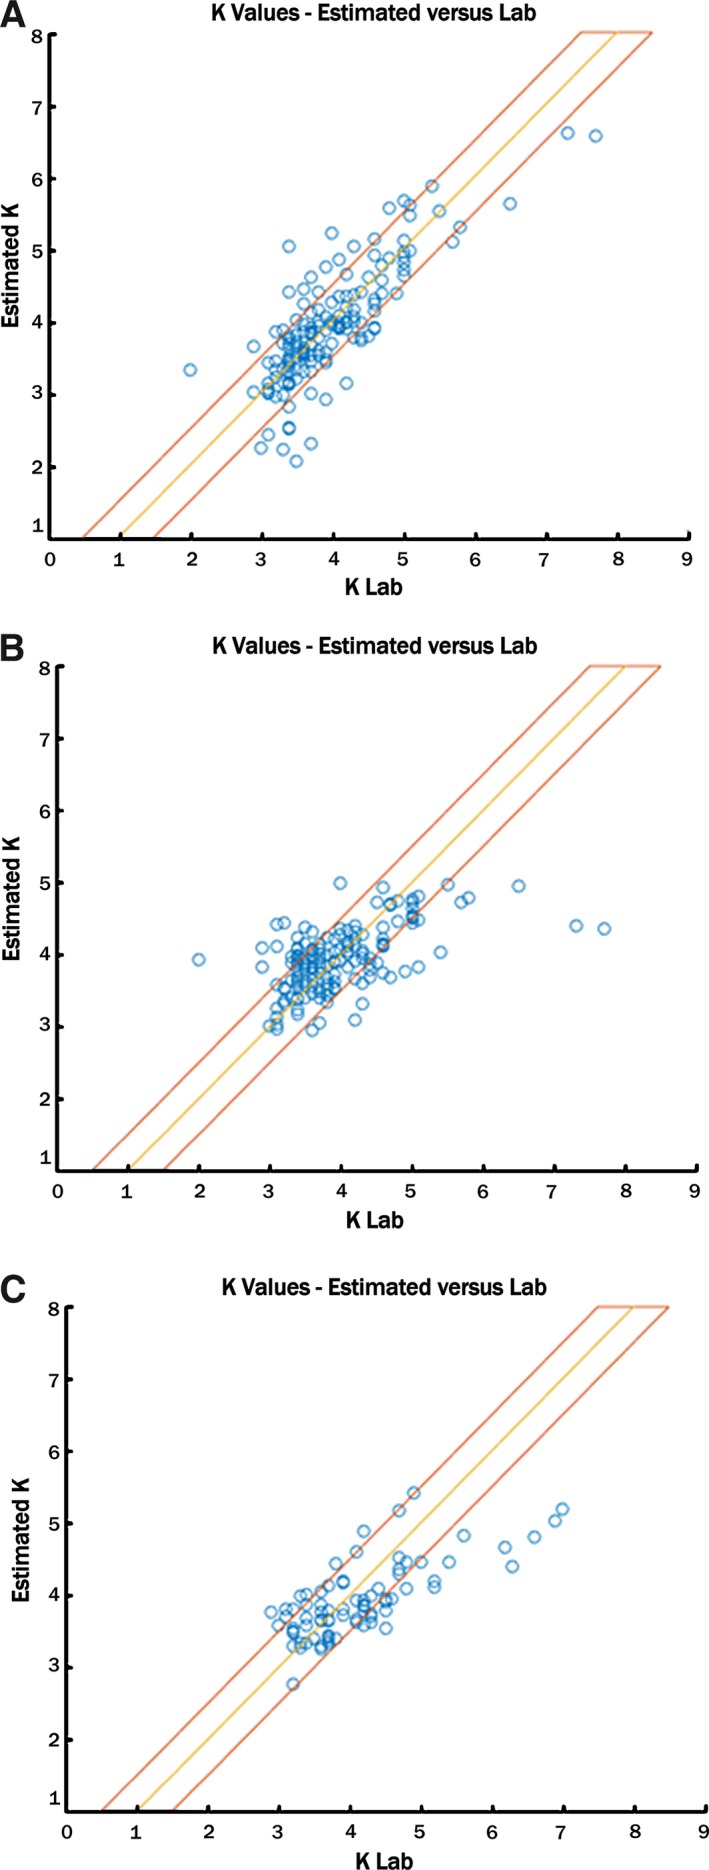
Algorithmically calculated and laboratory potassium values. A, The algorithmically estimated potassium value using the personalized prediction system is on the ordinate, and the laboratory‐derived value is on the abscissa. Panels (B) and (C) reflect the same, using the global methodology. B, The first dialysis run was used to create global parameters, and those parameters were then tested in the same patients in dialysis runs 2 and 3. C, A separate validation set of patients was used to test the parameters developed using patient group 1. The yellow line represents a perfect match between calculated and laboratory potassium values, and the red boundaries represent the area for which each predicted value is within the 0.5 mmol/L absolute error range.