
Figure 12.
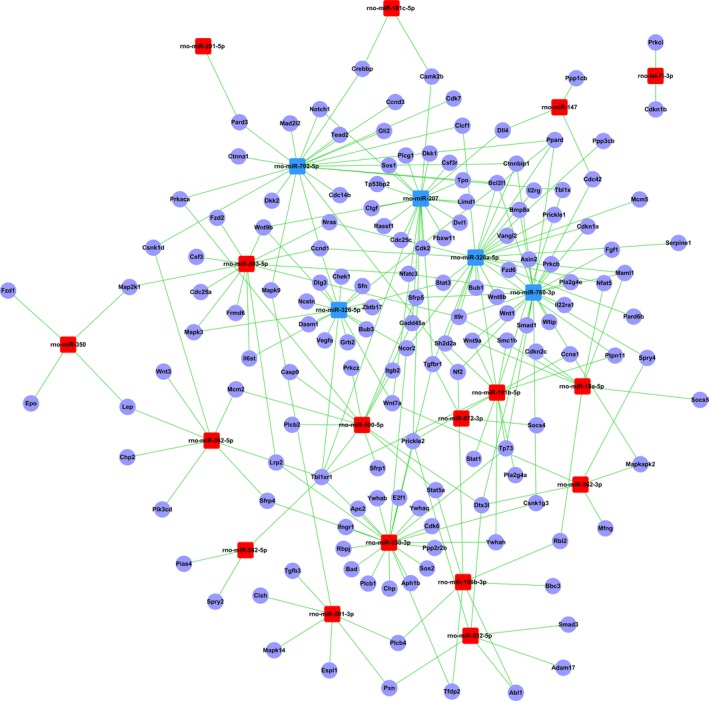
The microRNA (miRNA)–gene network. Blue and red box nodes represent miRNA, and purple cycle nodes represent mRNA. Edges describe the inhibitive effect of miRNA on mRNA. Blue box nodes show the underexpression microRNA–mRNA network, and red box nodes show the overexpression miRNA–mRNA network.