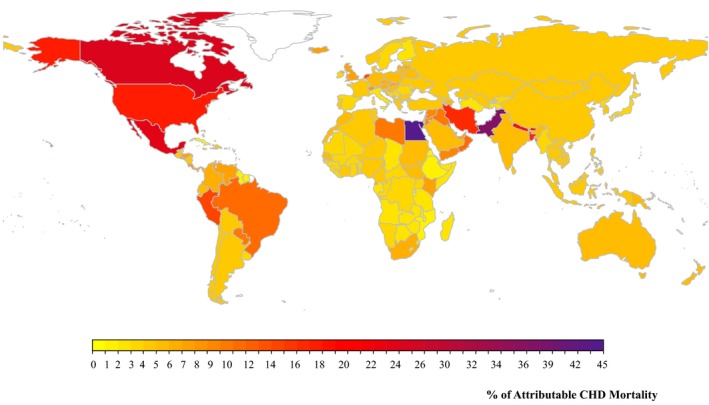
Figure 6.

Global proportional CHD mortality attributable to higher TFA intake in 2010. The proportion of CHD mortality attributable to TFA was calculated by dividing the number of attributable CHD deaths by the total number of CHD deaths within each country. The color scale of each map indicates the proportional CHD mortality in 186 countries attributable to TFA. The optimal level is 0.5±0.05%E (percentage of total energy intake). CHD indicates coronary heart disease; TFA, trans fat.
