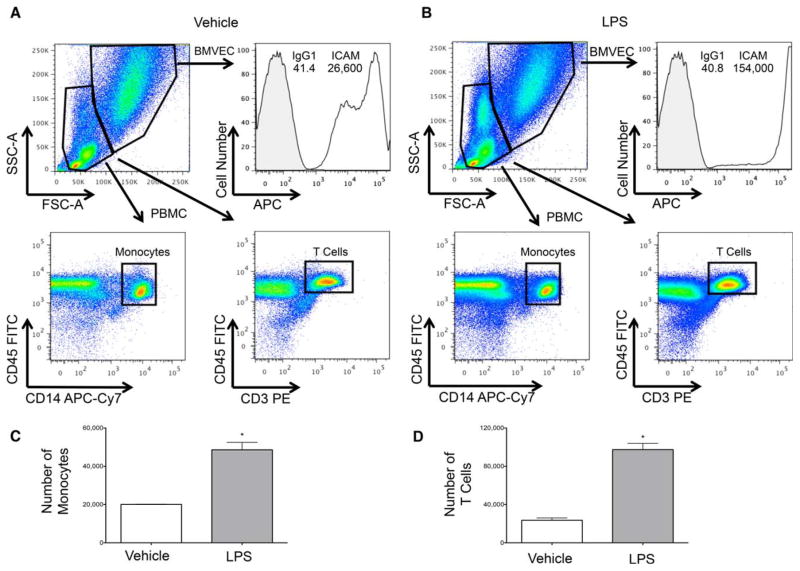
Figure 5.
Quantification of monocyte and T-cell adhesion to the BBB. PBMC were added to the BBB coculture model following pretreatment with (A) vehicle control or (B) 10 ng/mL LPS. Following 1 h of incubation and washing away nonadherent cells, TrypLE was used to collect the PBMC and the BMVEC from which they were interacting. SSC-A and FSC-A characteristics were used to create grates that discriminated between the PBMC and BMVEC. A histogram depicts BMVEC ICAM expression from one representative experiment. Rectangle gates were applied to the CD45+CD14+ and CD45+CD3+ PBMC populations and the number of cells within these gates enumerated. The number of (C) monocytes and (D) T cells that adhered to the BMVEC upon vehicle and LPS treatment in three separate experiments was determined. Data are represented as mean ±standard error of the mean. Significance was determined by a two-tailed paired t-test. ** P <0.01. [Color figure can be viewed in the online issue, which is available at wileyonlinelibrary.com.]

