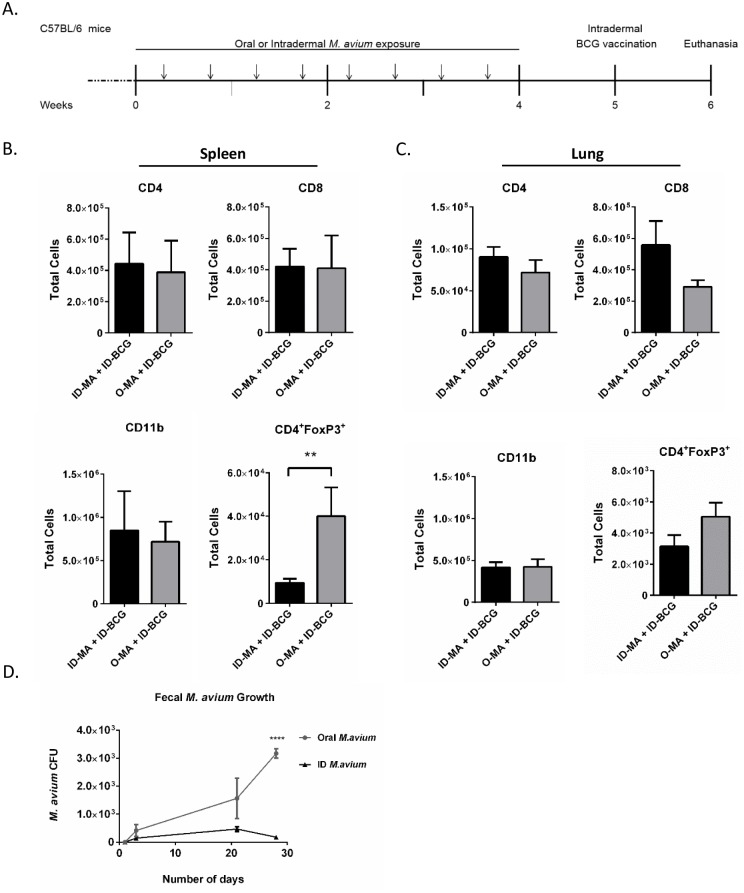
Fig 2. Analysis of cell phenotypes present in spleen and lung tissues after oral or intradermal presensitization to M. avium.
(A) Experimental design. Arrows indicate M. avium exposure. (B & C) Number of CD4+, CD8+, CD11b+, and CD4+FoxP3+ cells in the spleens (B) and lungs (C) of mice; n = 8 over two separate experiments. (D) Number of M. avium CFU in the pooled feces of mice presensitized to M. avium by different exposure routes. Data collected over two separate experiments (n = 8). A Mann-Whitney U test was used for comparison.*p < .05; **p < .01; ***p < .001 data shown with standard error of the mean (SEM). Abbreviations: Intradermal M. avium presensitization with intradermal BCG vaccination (ID-MA + ID-BCG), oral M. avium presensitization with intradermal BCG vaccination (O-MA + ID-BCG).

