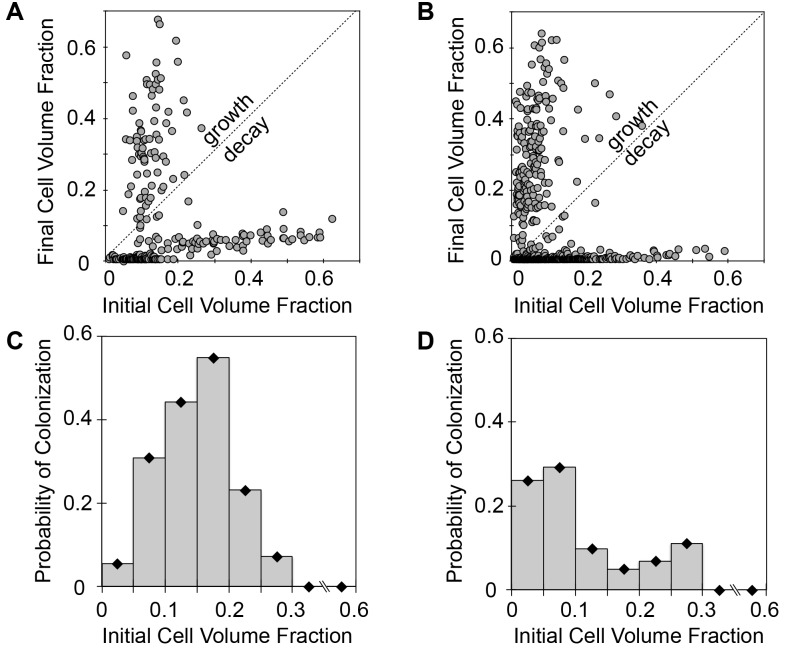
Fig 6. Growth of P. aeruginosa in confined volumes depends on inoculum levels.
(A) Scatter plots of initial and final (t = 24 hrs) cell volume fraction in 10 μm diameter wells and (B) 5 μm diameter wells. Growth-decay line deciphers wells that increased or decreased in cell numbers over the incubation period. (C) Probability of well colonization with initial volume fraction of seeded cells for in 10 μm diameter and (D) 5 μm diameter wells. Data was taken from n = 256 wells for 10 μm diameter arrays and n = 840 wells for 5 μm diameter arrays from 4 independent growth experiments.

