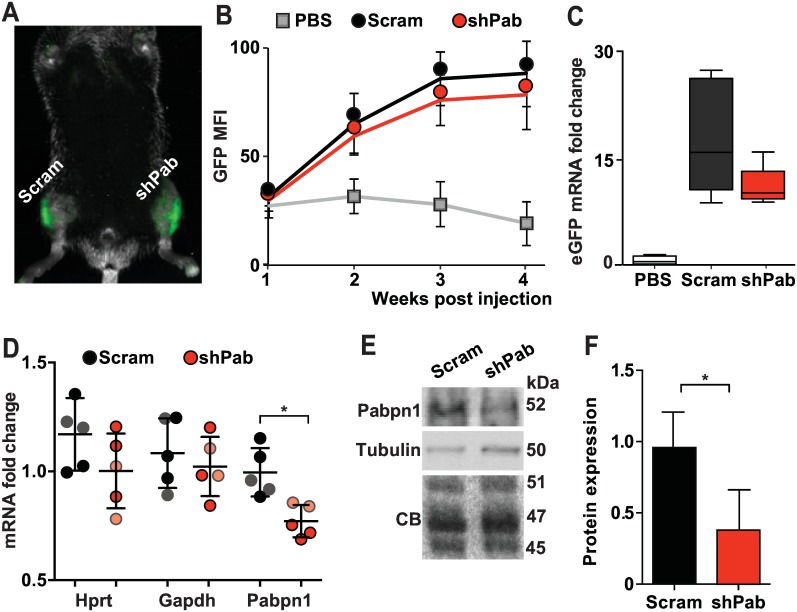
Fig 1. Pabpn1-DR in mouse TA muscles.
A. A representative fluorescence image at four weeks post-injection of AAV containing shRNA construct to Pabpn1 or Scramble RNA. The GFP signal is localized into the injected TA muscles. B. GFP expression is stabilized three weeks post injection. C. Box plots show fold-change of eGFP mRNA expression in five mice and averages were normalized to PBS injected mice. D-F. Pabpn1 levels. D. Dot plot shows Pabpn1 mRNA Hprt and Gapdh levels in all injected mice. Hprt and Gapdh levels were normalized to mean Ct value in PBS injected mice. Pabpn1 levels were normalization to the mean of Gapdh and Hprt and PBS injected. Faded color circles mark mice with lower Pabpn1 levels. Means and SD are depicted with lines. E. A representative Western blot shows Pabpn1 and Tubulin proteins. Loading controls are denoted by Tubulin or Coomassie blue (CB) stained gel. F. Bar chart shows mean Pabpn1 accumulation is Scram and shPab muscles. Pabpn1 levels were normalized to the average of three proteins (45, 47 and 51 kDa) from the CB gel. Averages and SD are from three mice with lowest Pabpn1 levels. Statistical significance was assessed by paired Student’s t-tests. P-values <0.05 was considered statistically significant and indicated by an asterisk.

