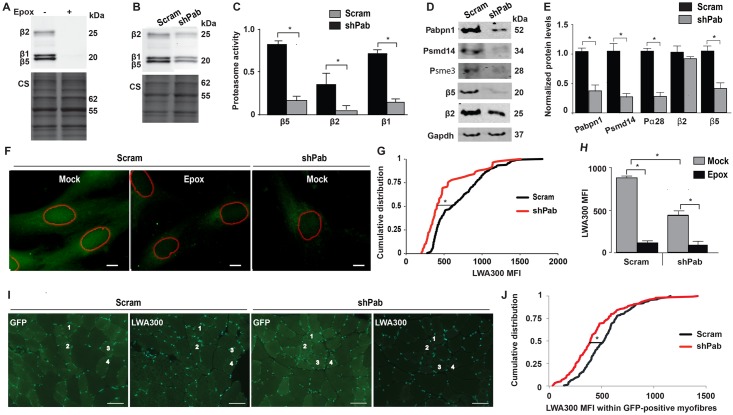
Fig 3. Proteasome activity in Pabpn1-DR cell culture and muscle tissue.
A-C. Analyses of β-subunits catalytic activity in muscle cell culture using activity gel. Specific binding of LWA300 to β-subunits is demonstrated by pre-incubation with 0.5μM Epox for 1 hour (A). Proteasomal activity in Scram vs. shPab muscle cell cultures (B-C), activity gel shows a representative experiment (B) Equal loading was assessed by Coomassie staining (CS). Bar chart (C) shows LWA300 MFI in after normalization to CS. Averages are from triplicates. D. A representative western blot shows protein levels of proteasome-encoded genes in Scram and shPab cell cultures. E. Bar chart shows quantification of protein fold change after normalization to Scram cultures. Averages and standard variations are from three independent experiments. Statistical significance (p<0.05; *) was made with unpaired Student’s t-test. F. Images show subcellular localization of LWA300 in Scram or shPab cell cultures. Cultures were incubated with 62.5 nM LWA300, pre-incubation with 0.5μM Epox was carried out as control. Segmented nuclei are depicted with red circles. Scale bar is 5 μm. G. Plot shows cumulative distribution of nuclear LWA300 MFI in Scram or shPab C2C12 cells. Statistical significance (p<0.05) was assessed with the Kruskal-Wallis test. H. Bar chart shows flow cytometer analysis of LWA300 MFI in Scram or shPab cell cultures treated with or without Epox. Averages are from three experiments. Representative histogram of flow cytometer output is in S2 Fig. I-J. LWA300 signal in muscle cryosections. I. Images show GFP or LWA300 fluorescence in successive cryosections from Scram or shPab. Examples of the four same myofibers in GFP and LWA300 are depicted with numbers. Nuclei were counterstained with DAPI. Scale bar is 50 μm. J. Plot shows cumulative distribution of nuclear LWA300 MFI in cryosections from three mice. Over 400 myofibers are included per condition per mouse. Statistical significance (p<0.05) was assessed with Kruskal-Wallis test.

