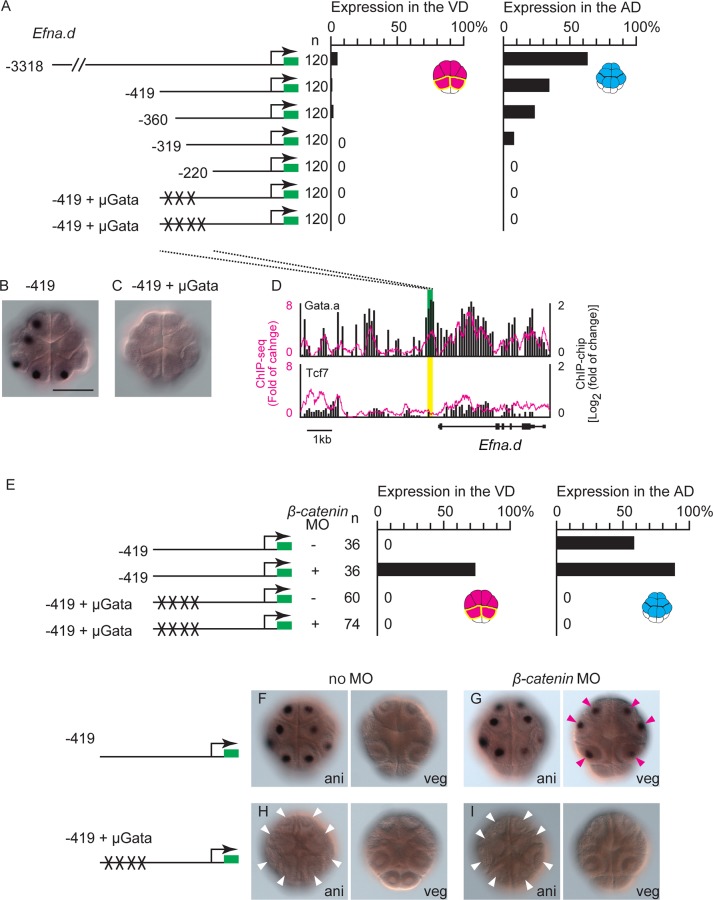
Fig 6. Gata-binding sites are critical for animal hemisphere-specific gene expression.
(A) Analysis of a regulatory region of Efna.d. Illustrations on the left depict the constructs. The numbers indicate the relative nucleotide positions from the transcription start site of Efna.d. Mutant Tcf7-binding sites are indicated by X. Graphs show the percentage of blastomeres expressing the reporter in the vegetal blastomeres and in the animal blastomeres. Note that not all cells could express the reporter because of mosaic incorporation of the electroporated plasmid, and not all embryos could express the reporter either. (B, C) Images showing Gfp expression in embryos electroporated with the second and sixth constructs shown in (A). (D) Mapping of the Gata.a and Tcf7 ChIP data onto genomic regions consisting of the exons and upstream region of Efna.d. The ChIP-chip data are shown in bars. The ChIP-seq data are shown as a magenta line. Each graph shows the fold enrichment (y-axis) for the chromosomal regions (x-axis). Green and yellow boxes indicate the region essential for specific expression, which was revealed by the reporter gene assays. The green box indicates that a peak was identified by the peak caller programs for ChIP-seq and ChIP-chip in the region, while the yellow box indicates that no peaks were identified in the region. (E–I) Expression of Gfp in embryos injected with constructs containing the essential 419 bp region of Efna.d. Coinjection of the β-catenin MO evoked ectopic expression of the reporter with intact Gata-binding sites in the vegetal hemisphere, while it did not evoke expression of the reporter with mutant Gata-binding sites. (E) Graphs show the percentage of blastomeres expressing the reporter in the vegetal blastomeres and in the animal blastomeres. (F–I) Images showing Gfp expression in embryos injected with (F, G) the reporter construct with intact Gata sites or (H, I) mutant Gata sites. The embryos shown in (G, I) were co-injected with the β-catenin MO. Animal views (ani) and vegetal views (veg) are shown in each panel. White and magenta arrowheads indicate loss of expression and ectopic expression of the reporter, respectively. Scale bar, 100 μm.

