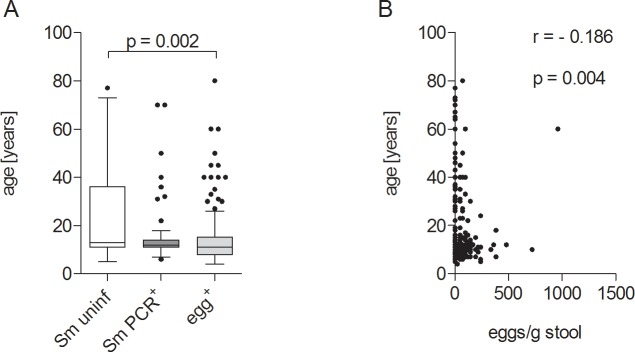
Fig 2. Gender and age distribution of study participants.
Study participants were grouped according to absence (Sm uninf = 61) or presence of S. mansoni DNA in blood (SmPCR+ = 63) or S. mansoni eggs in stool samples (egg+ = 110). (A) Distribution of age within all three groups. Data shows box whiskers with median, interquartile ranges and outliers. Statistical significances between the indicated groups were obtained after Kruskal-Wallis and Mann-Whitney-U tests. (B) Correlation of age with egg number, statistical significances were tested using the Spearman correlation test.

