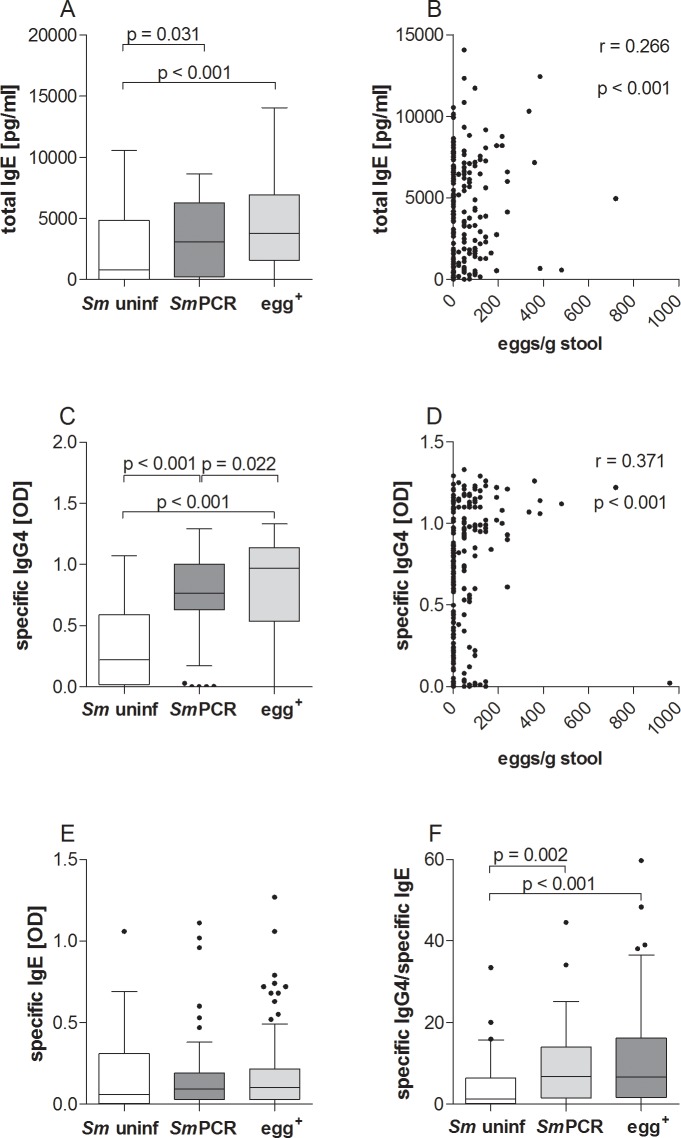
Fig 7. Higher levels of SEA-specific IgG4 but not IgE production in infected individuals.
Serum from all three groups was analyzed for the concentration of total IgE (A) and the optical density of SEA-specific IgG4 (C) and IgE (E) using ELISA. (F) depicts the ratio of antigen-specific IgG4/IgE. Graphs show box whiskers with median, interquartile ranges and outliers. Statistical significances between the indicated groups were obtained after Kruskal-Wallis and Mann-Whitney-U tests. Levels of total IgE and SEA-specific IgG4 immunoglobulins were further correlated with egg load (B and D respectively) and tested for statistical significance using the Spearman correlation test.

