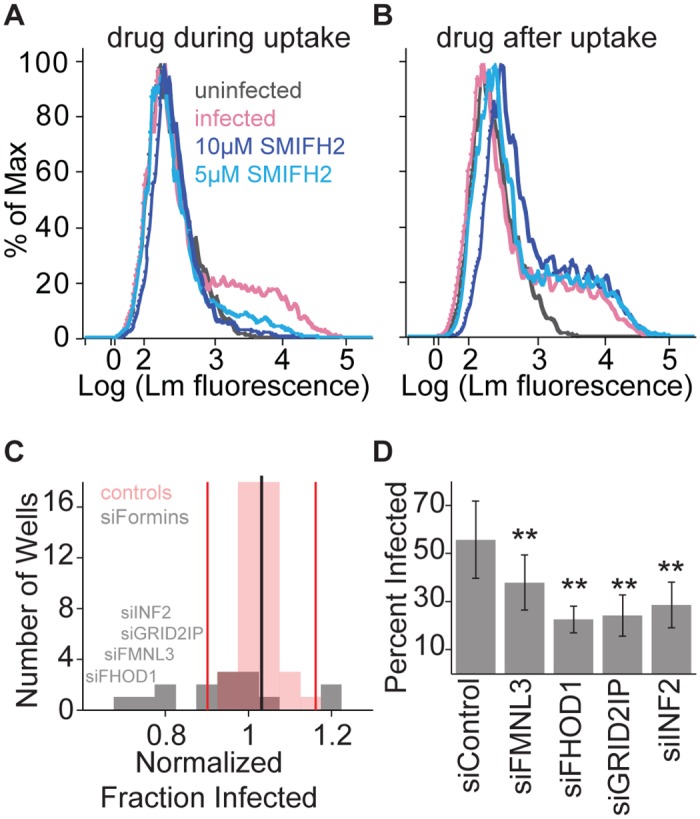
Fig 3. Formin activity is necessary for L. monocytogenes invasion in HUVEC.

HUVEC were infected with JAT983. (A, B) Histograms of bacterial fluorescence intensity per cell. Infection was analyzed by flow cytometry 7–8 hours after infection. In each trace, a minor peak of higher bacterial fluorescence indicates infected HUVEC. (A) Effect of formin inhibition on bacterial uptake. SMIFH2 or vehicle control (DMSO) was present during invasion at the concentration indicated, and washed out with the addition of gentamicin. (B) Effect of formin inhibition on cell-to-cell spread. SMIFH2 or vehicle control was added with gentamicin and therefore was present only after invasion. (C) Effects of formin knockdown on bacterial uptake. HUVEC were treated with siRNAs targeting all 15 mammalian formins (gray bars) or non-targeting siRNAs (red bars) and analyzed by flow cytometry 7–8 hours after infection. The value for each sample is the average fold change (from 3 independent experiments with 4 biological replicates per experiment), relative to the mean percent infected among control siRNA wells (black line). Red vertical lines represent two SD from the mean. Names are listed for formins that were subsequently confirmed to be significantly different from controls. (D) Frequency of infected HUVEC (mean +/- SD, n = 4 biological replicates), for cells treated with siRNAs targeting FMNL3, FHOD1, GRID2IP, INF2, or non-targeting control siRNA, and analyzed by microscopy 8 hours after infection. P-values for each siRNA condition relative to control (unpaired two-sided, two-sample t-test, Benjamini-Hochberg correction): 0.0086 (siFMNL3), 1.0670 *10−5 (siFHOD1), 1.0670 * 10−5 (siGRID2IP), 0.0011 (siINF2).
