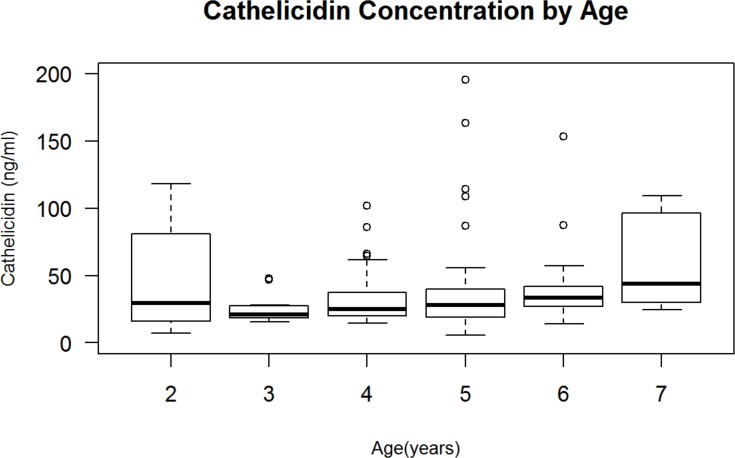
Fig 1. Cathelicidin Concentration by Age.
There was a significant positive correlation between age and cathelicidin concentration (ρ = 0.236, p = 0.005); ρ value represents Spearman correlation. The upper and lower edges of the box represent the 75th percentile and the 25th percentile of cathelicidin concentration, respectively, measured by ELISA and reported in ng/mL.

