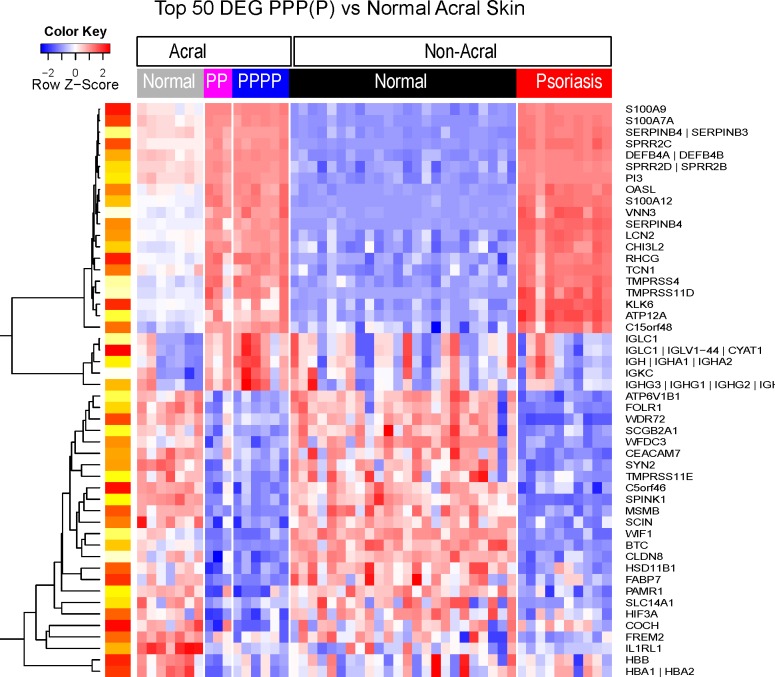
Fig 3. Heat map representing the expression profiles of the top 50 differentially expressed genes (DEG) of PPP/PPPP versus normal acral skin.
Gene expression patterns from PPP/PPPP and normal acral skin are strikingly different. For DEG (FDR<0.05, FCH>2), the top 25 up and 25 down-regulated genes in terms of the fold change are presented according to an unsupervised cluster analysis. Yellow-red scale: red represents low gene expression and yellow high gene expression.

