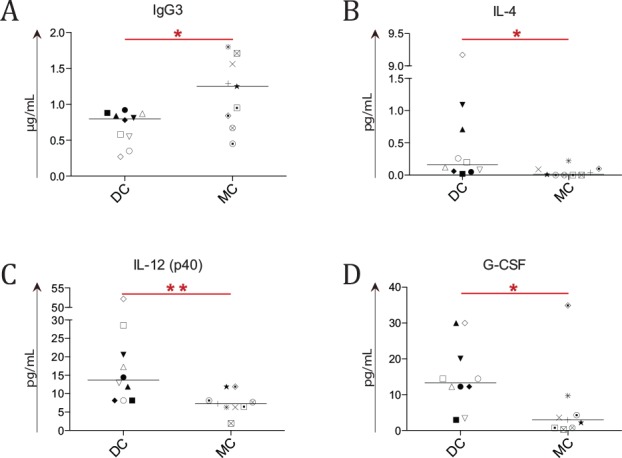
Fig 1. Comparison of soluble biomarkers between patients with mixed and donor chimerism.

Concentrations of cytokines, IgG and IgG subclasses were determined in the plasma of 9 mixed chimerism (MC) and 10 donor chimerism (DC) patients at median 10 years post-HSCT. Asterisks indicate significant P-values (* = P < .05 and ** = P < .01), symbols indicate individual patient levels and horizontal bars in scatter graphs indicate median values of the patient group. (A) A higher IgG3 concentration was seen in MC patient plasma (P = .027). (C-D) A lower concentration of IL-4 (B), IL-12 (p40) (C) and G-CSF (D) was observed in MC patients (P = .016, P = .003 and P = .022 respectively).
