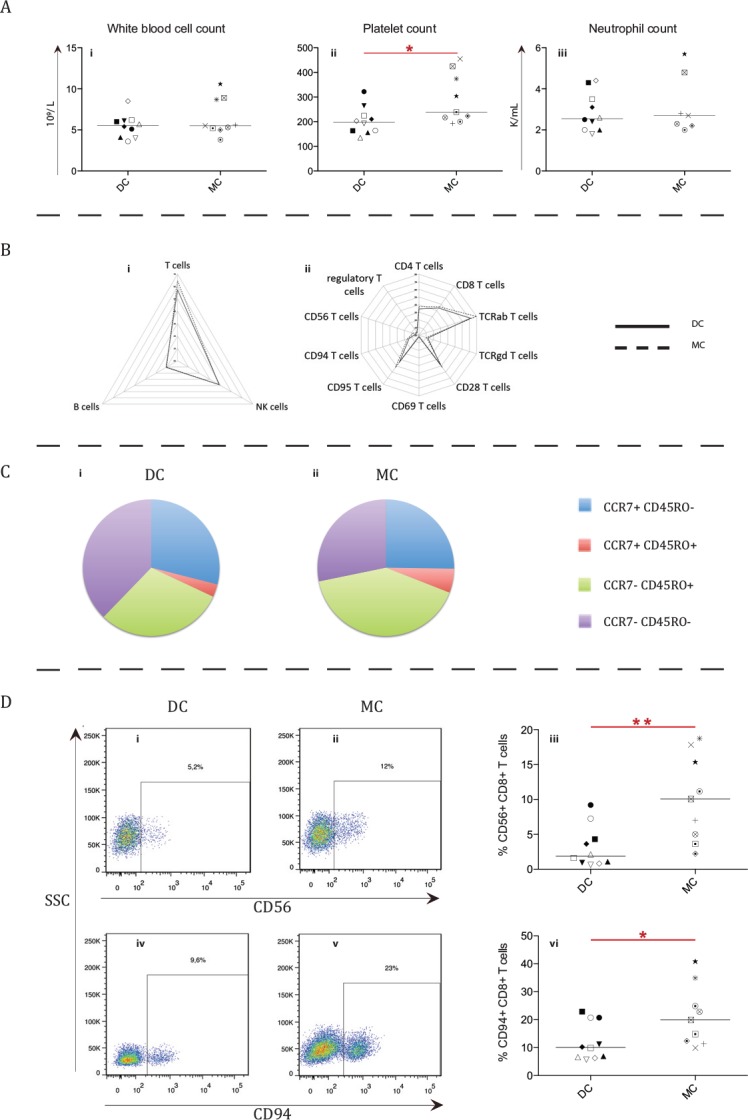
Fig 2. Phenotypic comparison of cellular subsets between patients with mixed and donor chimerism.

For most cellular subsets no significant differences were observed between 9 mixed chimerism (MC) and 10 donor chimerism (DC) patients (A-C). Asterisks indicate significant P-values (* = P < .05 and ** = P < .01), symbols indicate individual patient levels and horizontal bars in scatter graphs indicate median values of the patient group. (A) The white blood cell (i), platelet (ii) and neutrophil (iii) count in the two patient groups. Platelet counts were higher in MC patients (P = .041). K/mL = 1 000 cells/mL. (B) Radar graphs depicting relative distribution of T, B and NK-cells (i) and T-cell subsets (ii) for DC and MC patient groups. (C) Differentiation status of total T-cells (CD3+), as defined by naïve memory (CCR7+ CD45RO-), central memory (CCR7+ CD45RO+), effector memory (CCR7- CD45RO+) and terminally differentiated memory (CCR7- CD45RO-), was found to be similar between the DC and MC patient groups. (D) Representative FACS plots of potential NKT-cells (CD56+ (i-ii) or CD94+ (iv-v)) gated on CD8+ T-cells. In the corresponding graphs (iii, vi)), individual ratios of the subsets for each group are shown (P = .004 and P = .035 respectively).
