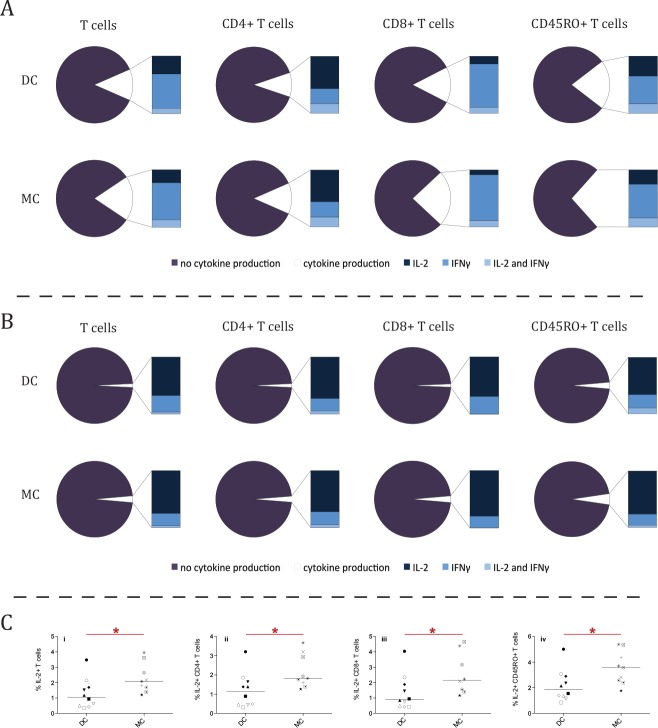
Fig 4. Higher frequency of IL-2-producing cells for steady state lymphocytes in mixed chimerism patients.
The frequency of IL-2 producing cells after a 4 hour mitogenic stimulation of 9 mixed chimerism (MC) and 10 donor chimerism (DC) patients. (A) Median frequency of IL-2 and IFNγ producing lymphocytes of several T-cell (CD3+) subsets (total T-cells, CD4+ T-cells, CD8+ T-cells and CD45RO+ T-cells) in the mixed chimerism (MC, n = 9) and donor chimerism (DC, n = 10) groups after a 4-hour mitogenic stimulation with PMA and Ionomycin. No statistical difference was observed between the patient groups. (B) Pie charts displaying the median results for the same T-cell subsets after a 4-hour non-stimulation (simulating steady-state production of IL-2 and IFNγ). A higher frequency of IL-2 producing cells could be observed. (Ci-iv) The dot plots display a difference in the frequency of IL-2 producing cells between the DC and MC patient groups in the non-stimulation condition for the same T-cell subsets. The frequency was higher for total T cells (i), P = .017; CD4 T cells (ii), P = .034; CD8 T cells (iii), P = .034; and memory (CD45RO+) T cells (iv), P = .022. Asterisks indicate significant P-values (* = P < .05), symbols indicate individual patient levels and horizontal bars in scatter graphs indicate median values of the patient group.

