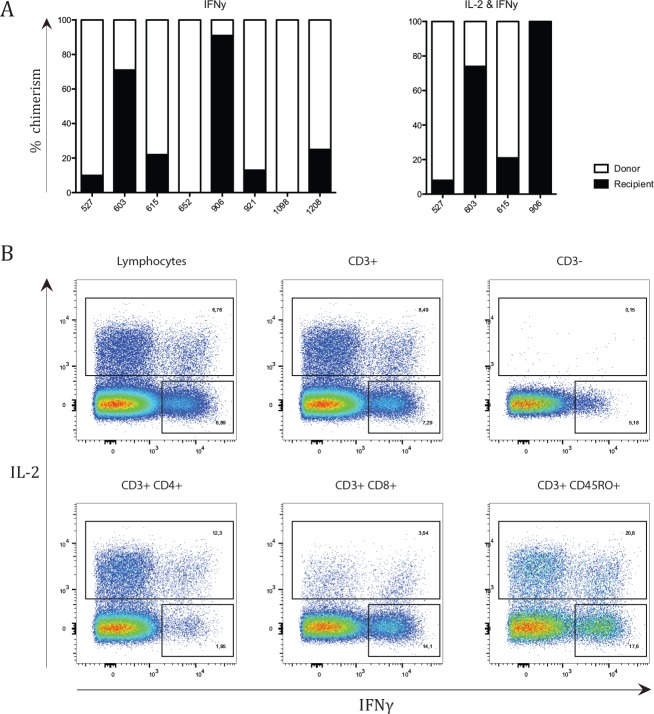
Fig 6. Recipient derived cells capable of cytokine production.
(A) Each graph depicts percentages of chimerism for cytokine producing lymphocytes after a 4-hour incubation with PMA and Ionomycin. Chimerism was analysed for IFNγ-producing lymphocytes and IL-2 and IFNγ producing lymphocytes. A black column represents the percentage of recipient derived cells, while the white column represents donor-derived cells. ND depicts the subsets where chimerism analysis was unsuccessful due to insufficient DNA. (B) A representative plot from patient UPN 615 demonstrates the gating strategy used on varying cellular subsets. Sorting was done on total lymphocytes.

