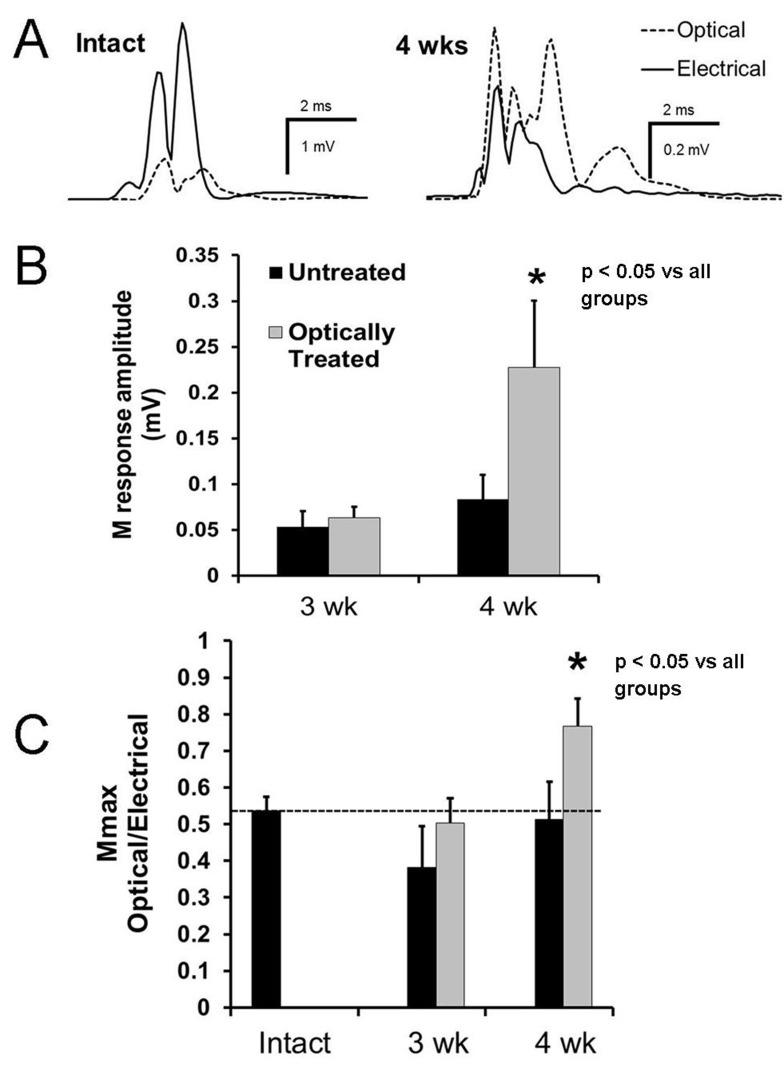
Fig 5. Functional assessment of the gastrocnemius innervation following nerve injury.
M responses elicited by optical and electrical nerve stimulation were measured three and four weeks after transection and repair of the sciatic nerve. A. Examples of electrically evoked (solid traces) and optically evoked (dashed traces) M responses recorded from the gastrocnemius muscle of a thy-1-ChR2/YFP mouse. Recordings were made prior to (Intact) and four weeks after transection and surgical repair of the sciatic nerve, followed by one hour of optical stimulation. B. Mean (+SEM) M response amplitudes, evoked optically from the gastrocnemius muscles at three and four weeks after sciatic nerve transection and repair are shown for both: optically treated and untreated animals. * p < 0.05 vs all other groups. C. The mean (+SEM) ratio of optically evoked to electrically evoked M responses recorded from gastrocnemius muscles of optically treated and untreated mice is shown. Measurements presented were made in Intact animals and three or four weeks after transection and repair of the sciatic nerve. The horizontal dashed line is placed at the mean ratio found in intact mice. * p < 0.05 vs all other groups.

